3

With DEM as a source, I created all necessary files like flow direction, accumulation, slope, streams, watersheds, pour point etc... In my watershed (basin), I have many sub-watersheds (sub-basin) with streams and outlets at various elevations. I need to do analysis on the following two basis.

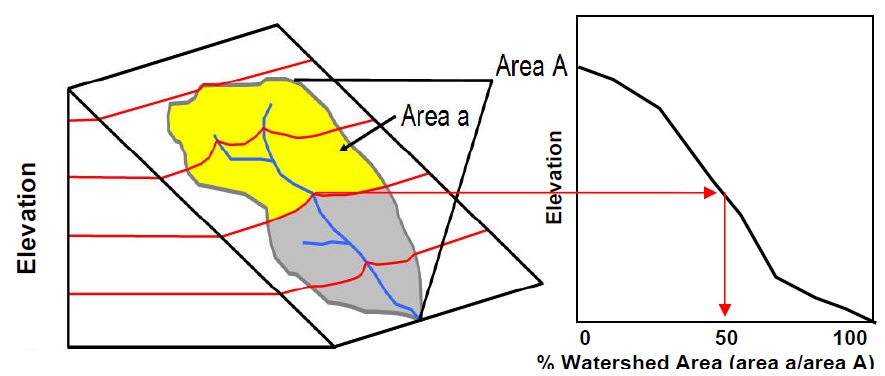
  1. I need to calculate for every basin/sub-basin, the drainage area at every elevation contour along the stream. Please ref figure for better understanding my view.
  2. I the figure there are six elevation contours (2 black top-bottom, 4 red in between) in the basin/sub-basin. In the figure, outlet is at the bottom elevation. Now I want to change outlet to all above elevations along the stream. And for each elevation point outlet along the stream, I need to calculate drainage area and volume.

I am trying various options with ArcGIS, Global Mapper, AutoCAD, Surfer, MicroStation and others...

Please give me some idea in doing this watershed analysis with less effort with any of the above said software/tools/extensions/toolbox with better accuracy. Analysis
6
  • added as comment because my experience is dated with this model. resources.arcgis.com/content/hydro/surface-water/about
    – Brad Nesom
    Commented Mar 19, 2012 at 15:17
  • Hi,Brad, I have used archydro to generate all my sterams and watersheds.But I didn't get how to do my above said 2 types of analysis.Thanks for your time and support. Commented Mar 19, 2012 at 15:32
  • In question (1), do you just want to find the area of the watershed at elevations above or equal to a given (contour) elevation? Question (2) needs a reformulation, because it's hard to make sense of the critical phrase, "change outlet to all above elevations along the stream."
    – whuber
    Commented Mar 19, 2012 at 16:25
  • For -Q1) It's one direction (above) not two directions ( above and below). If you see the corresponding graph to the watershed, The drainage area of the basin at the outlet is 100% and going above elevations,drainage area at the respective elevations is some portion of basin area and it is nearing 50% of total basin area at second from botton red elevation. (similar to hypsometric curve). For - Q2) I want to keep outlets at the point where red elevation crocess blue stream.I mean I will get one outlets at bottom two red and two outlets at 3rd from bottom red elevation and blue stream crossing Commented Mar 19, 2012 at 16:52
  • If you also are looking into the MapInfo based software, Encom Discover might be an option. It has a build-in Hydrology Module that could help you out Commented Mar 19, 2012 at 20:05

4 Answers 4

3

For Q1, if you aren't recalculating the watershed at each contour line, you can use the Split Polygons tool in ArcMap to chop up your watersheds. You need an ArcEditor or ArcInfo license to use it. It will chop the watersheds by the contour lines and retain attributes.

So, a possible process could be to have an acreage field from the original watersheds, split the watersheds, add another acreage field and calculate acreages on the new polygons, then use the Field Calculator on a third field to determine percent of total acreage in each subwatershed.

This method assumes you have converted watersheds to vector data and that the contour lines are also vector data.

3

These are actually multiple questions, and should maybe be split up, but here is a partial answer regarding the calculation of the percentage of the watershed upstream for each pixel along the flowpath:

Lets assume you are doing this in ArcGIS:

1) Determine your streams You have calculated a flow accumulation grid, the basis for a stream network. In order to derive actual stream, you need to decide on a threshold at which a stream is formed. Apply this threshold, by reclassifying the flow accumulation grid to 1 - where the threshold is exceeded - and to 0 - where the threshold is below. The result is something like the blue river network in your graph, where a value of one means "river" and zero means "no river".

2) Determine upstream area for river network Next multiply (using the raster calculator) the result from step 1 with the flow accumulation grid. This grid results in the number of upstream cells for each pixel of the stream network. Calculate the percentage of the upstream cells by dividing the pixel value by the watershed area ( = maximum flow accumulation value) and multiply by 100 to derive percentages. If you want to do the calculations on real areas, first multiply the flow accumulation grid by the area of one pixel.

3) Make a graph and pick/calculate the values at your desired interval.

2

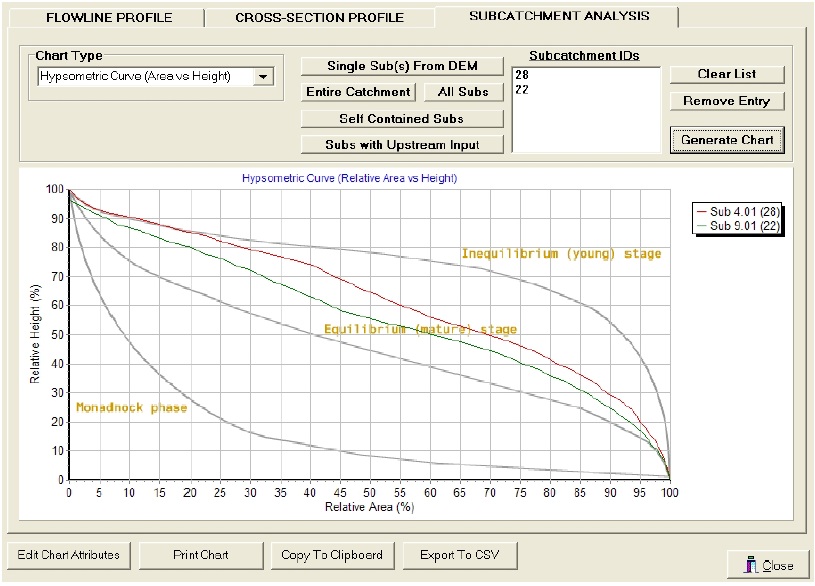
During my research, I found partial answer to my question in CatchmentSIM-GIS software which will give such analysis.Attached figure is for better idea. It has subcatchment analysis tab where we can change sub-basins (subcatchmentIDs). It is doing analysis for entire catchment (see the tab "entire catchment" in fig) and all subcatchments(see tab "all subs" in fig) and also individual subcatchments by providing IDs. I dont have this software and didnt find the same in internet. So I request all of you to provide some light to get possible solution with arcgis.enter image description here

1

Why dont you consider QGIS/GRASS combination for your watershed analysis? GRASS has specific watershed function that you can access from QGIS.

Youtube has some demo videos on GRASS/QGIS watershed analysis.

more reading material here;

http://www.ing.unitn.it/~grass/docs/tutorial_62_en/htdocs/esercitazione/dtm/dtm4.html

http://jentjr.blogspot.com/2011/06/watershed-analysis-using-grass-gis.html

Your Answer

By clicking “Post Your Answer”, you agree to our terms of service and acknowledge you have read our privacy policy.

Not the answer you're looking for? Browse other questions tagged or ask your own question.