2

I have calculated a voronoi layer for a set of points, I then joined said layer with counts so (almost) each point that generated that polygon has a number associated to it.

My question is: how do I color each polygon according to its count in QGIS?

My data is simply the voronoi layer (I don't exactly know where it gets the data for drawing the polygons), an ID for each point that generated that polygon, and a count associated to it. Like this:

   ID, COUNT
 ABC1,    12
 ZXI6,   234
 ...

But that's all I have. In any case, each ID has a lat/lon pair, again the point that generated the polygon.

I'm sorry I cannot upload a raw screencapture of the table, the data is sensitive.

1
  • Can you add screen shot of your layer and attribute table?
    – whyzar
    Commented Nov 29, 2016 at 17:17

1 Answer 1

2

Just using a sample polygon shapefile with a counts field.

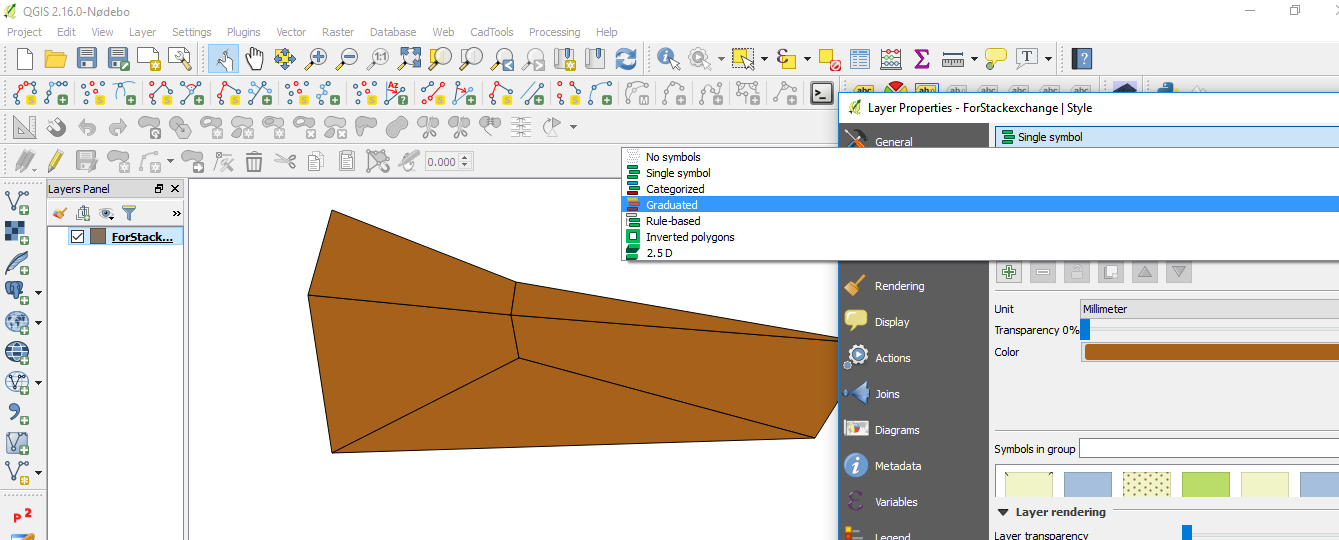
It should be as simple as changing the Layers symbology: enter image description here

  • Right click the layer, and access its properties and go to the Style Tab
  • Change the Single Symbol -> Graduated Symbol
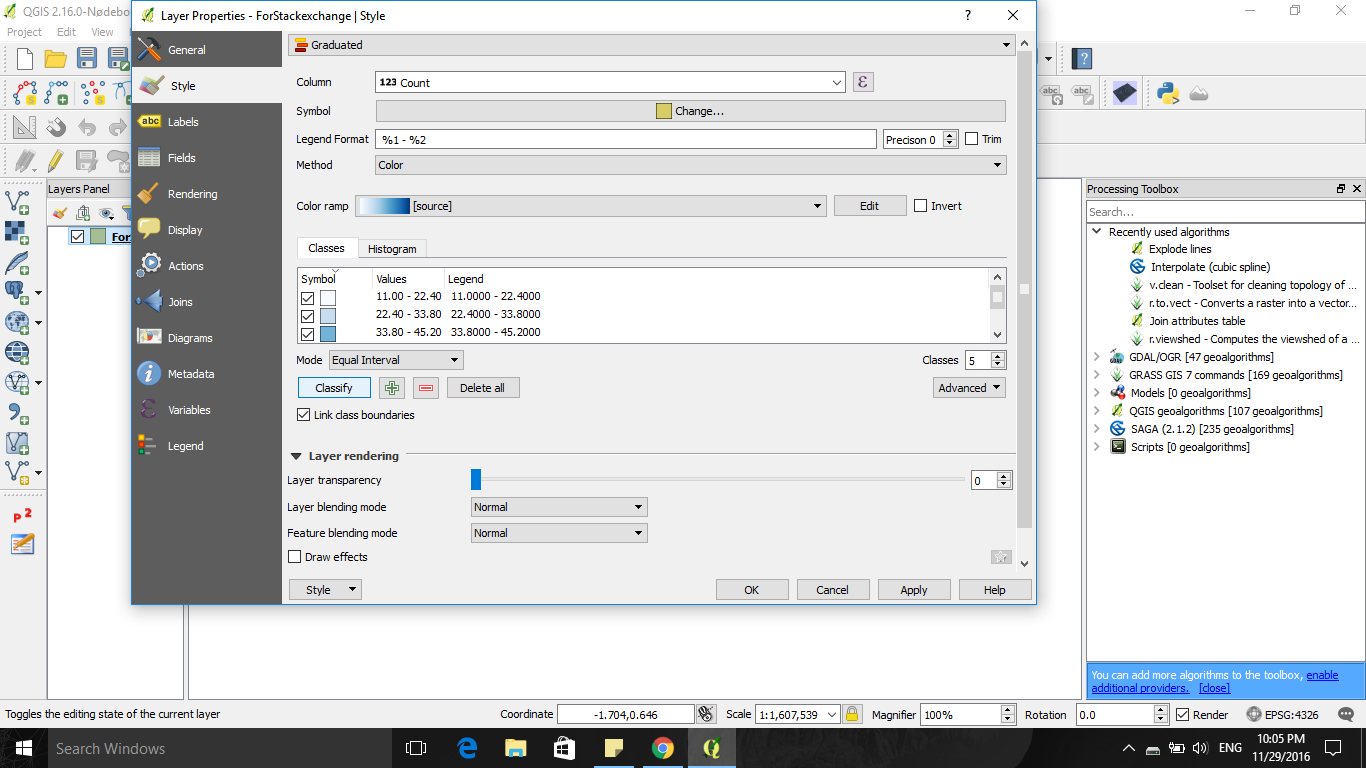
  • Select your Counts Field as the Column
  • Select your number of classes/classification mode

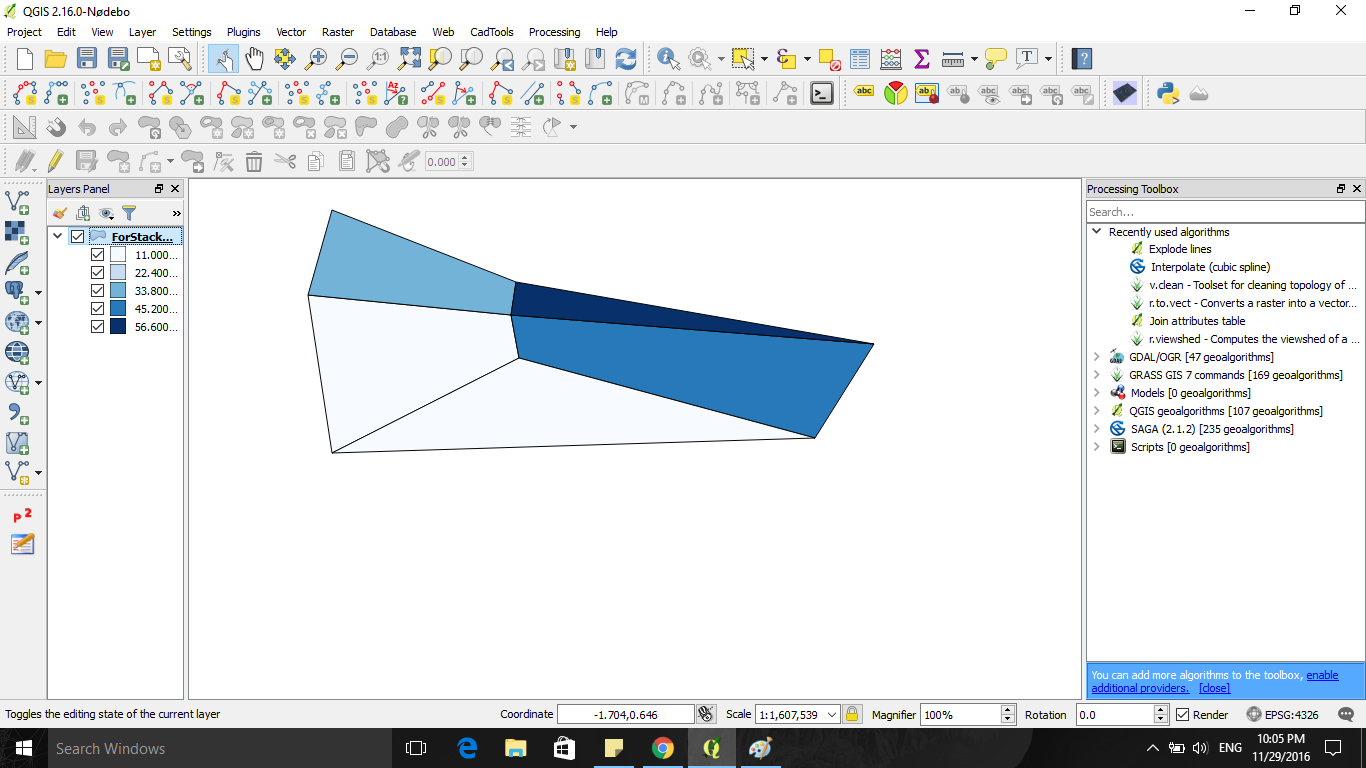
enter image description here - Push Classify - Apply the changes.

enter image description here

If you want an individual color for each Row you can use Categorized as opposed to Graduated Comment as to whether or not this is what you are looking for, if not I will change the answer to adapt.

Use Print Composer to make a choropleth map

Your Answer

By clicking “Post Your Answer”, you agree to our terms of service and acknowledge you have read our privacy policy.

Not the answer you're looking for? Browse other questions tagged or ask your own question.