7

I have a polygon layer in QGIS, and would like to represent the polygons like in the below image:

enter image description here

I have tried two different approaches, none of which are satisfactory.

enter image description here

Using a line pattern fill, the entire polygon is filled with the line pattern. I need a blank area in the middle which is not filled in.

enter image description here

Using a marker line fill, I am able to keep a blank area in the middle, but the markers are rotated to align with the edges of the polygon. I need the markers to preserve the same rotation along all edges, like in the example above.

Any ideas?

3 Answers 3

11

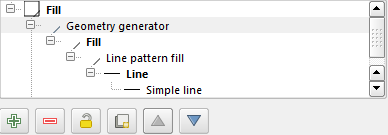
I think you can use Geometry generator.

Following this post Geometry generator symbology by Matthias Kuhn, you can:

  1. Choose Geometry generator
  2. Type in expression: difference($geometry, buffer($geometry, -100))
  3. Set Line pattern fill

enter image description here

4
  • Very close to what I want! Only issue is that the unit used by buffer() depends on the CRS. With the map projection I am using, this means that the geometry generated does not appear to have the same width on all sides of the polygon. Do you know if it is possible to change the unit used by buffer(), for example to millimetres? Commented Feb 18, 2017 at 10:16
  • To illustrate: i.sstatic.net/MV0xE.png Notice how the western edge appears thinner than the others Commented Feb 18, 2017 at 10:26
  • @J.Hougaard Sorry, it is probably beyond my reach. Btw the figure looks stretched in north-south direction. Which CRS are you using, if i may ask?
    – Kazuhito
    Commented Feb 19, 2017 at 1:00
  • @J.Hougaard it works for me if layer and project CRS both are in meters.
    – AndreJ
    Commented Feb 19, 2017 at 7:47
4

I'm going to add another suggestion because this question has just popped up as a duplicate so might get some more traffic.

If you can stomach some processing it's possible to get exactly what you want by physically buffering rather than using the geometry editor as in the accepted answer. This should also do away with the issues identified in the comments above (I think).

  1. Run a fixed (or variable if you need different features to have a different hashing pattern) distance buffer on the features you want to symbolise, using a minus value to reduce the size of the feature.

enter image description here

  1. Run the 'Difference' tool from the Vector Geoprocessing menu to doughnut hole cut the original feature and drop this new dataset into the TOC above the original

enter image description here

  1. Symbolise the original dataset with a simple outline (and either no fill or whatever colour you want) and the new doughnut dataset with no outline and a hash fill

enter image description here

2

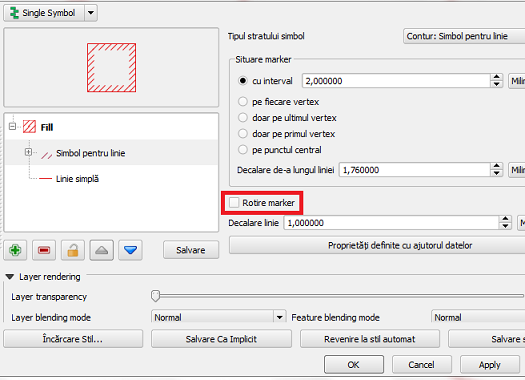
You can also uncheck the rotate marker option and tweak the line interval and offsets (sorry that my UI is only partially in English).

enter image description here

1
  • No doubt better than what i had, but still not perfect. The markers will overlap, and not fill in the corners: i.sstatic.net/mp1Ko.png Commented Feb 18, 2017 at 10:25

Your Answer

By clicking “Post Your Answer”, you agree to our terms of service and acknowledge you have read our privacy policy.

Not the answer you're looking for? Browse other questions tagged or ask your own question.