4

I am trying to overlay point data with polygons in R in order to find the polygons which intersect with the points provided.

  1. The assciated prj file from the polygons shows their coordinate reference system: "DATUM["D_ETRS_1989",SPHEROID["GRS_1980",6378137.0,298.257222101]]".

    The file is available here http://mapas.ine.pt/download/index2011.phtml.

  2. Then I have sample points. The point coordinates come from the Google API and are transformed to WGS 1984.

    The point data set is here https://www.dropbox.com/s/1r1rzmhjhqcsarv/Points.csv?dl=0.

But when I try to overlay both, an dataframe is returned filled with NAs.

When I plotted both files in QGIS for visual checking, I found that all most all points are aggregated in one polygon. However they should spread over Portugal,(even beyond the polygon outcrop which is Lisbon)

There should be a corruption of the coordinate system at one point, but I cannot find it!

I set a common coordinate reference system for polygons and points (WGS 1984) and repaired the polgyon with cleangeo. Below the commented code I used.

(A) Load points and polygons

(A1) Define common CRS

CRS.new <- CRS("+init=epsg:4326 +proj=longlat +ellps=WGS84 +datum=WGS84 +no_defs +towgs84=0,0,0")      

(A2) Read points from csv and build SpatialPointDataFrame

Points <- read.csv("Points.csv", header = TRUE, sep = ";")                         

Points_coords <- Points[,c(3,4)]
Population <- SpatialPointsDataFrame(coords = Points_coords, data = Points,proj4string = CRS("+proj=longlat +datum=WGS84 +ellps=WGS84 +towgs84=0,0,0"))

(A3) Read polygons from BGRI dataset

Portugal_subsections <- readShapeSpatial("BGRI11_LISBOA.shp")  
Portugal_subsections@proj4string <- CRS.new  

(A3) Fix polygons with cleangeo

report <- clgeo_CollectionReport(Portugal_subsections) ## Check topology error
clgeo_SummaryReport(report)

Portugal_subsections_clean <- clgeo_Clean(Portugal_subsections) ## Clean topology errors

report2 <- clgeo_CollectionReport(Portugal_subsections_clean)  ## Check again
clgeo_SummaryReport(report2)

(B) Saving files

(B1) Portugals subsections

Portugal_subsections_clean@proj4string  <- CRS.new
writeOGR(obj=Portugal_subsections_clean, dsn = ".", Portugal_subsections_clean", driver="ESRI Shapefile")

(B2) Saving Population as point shape

colnames(Population@data) <- c("Index","Zip", "lon", "lat", "Population")
writeOGR(obj=Population, dsn = ".", "Population", driver="ESRI Shapefile")

(C) Overlay Population with BGRI subsections

Portugal_subsections_clean@proj4string <- CRS.new  ## Assure same CRS (WGS 84)
Population@proj4string <- CRS.new  ## Assure same CRS (WGS 84)

a <- over(Population, Portugal_subsections_clean)

2 Answers 2

6

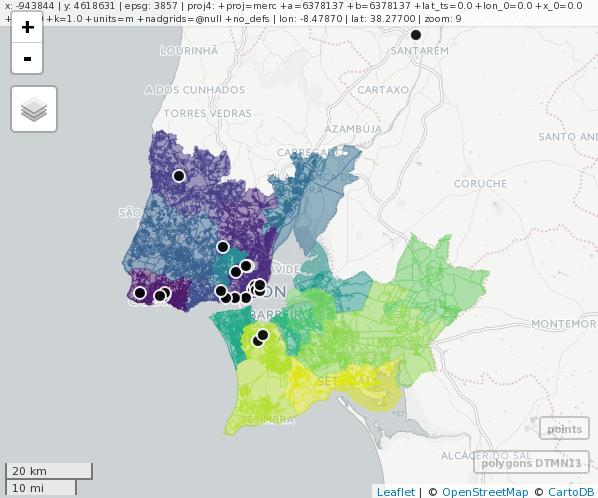
Try the commented and reproducible example below! I use the sf package because is much faster than rgdal to open Shapefiles. Also, I used the great package mapview for interactive visualization in R. I transformed the points object to polygon's default projection before doing the intersection.

Note: I downloaded the Points.csv file from Dropbox link first and saved it to working directory.

# Load libraries ----------------------------------------------------------

library('sf')
library('mapview')

# Download data -----------------------------------------------------------

# Download polygon
download.file("http://mapas.ine.pt/download/files/2011/nuts2/lisboa2011.zip", destfile = "lisboa2011.zip")
unzip("lisboa2011.zip")

# Load data ---------------------------------------------------------------

polygons <- sf::read_sf("BGRI11_LISBOA.shp")
points <- read.csv(file = "Points.csv", sep = ";")

# Convert points df to sf object
points <- st_as_sf(points, coords = c("lon", "lat"))
st_crs(points) <- "+init=epsg:4326 +proj=longlat +ellps=WGS84 +datum=WGS84 +no_defs +towgs84=0,0,0" # assign CRS to points

# Plot data
mapview::mapview(polygons, zcol = "DTMN11") + mapview::mapview(points, color = "white", col.regions = "black")

plot

# Overlay Population with BGRI subsections --------------------------------

# Transform points data
pointsT <- st_transform(points, crs = st_crs(polygons))
print(st_crs(pointsT))

# Plot transformed data to check is ok
mapview::mapview(polygons, zcol = "DTMN11") + mapview::mapview(pointsT, color = "white", col.regions = "black")

# Intersection
overlayOutput <- st_intersects(pointsT, polygons)

# Build intersected polygons object
intersectedPolys <- polygons[unlist(overlayOutput), ]

mapview::mapview(polygons, zcol = "DTMN11") + mapview::mapview(pointsT, color = "white", col.regions = "black") + mapview::mapview(intersectedPolys, color = "black", col.regions = "black")

plot2

Note: the intersected polygons are colored in "black".

2
  • I really appreciated your help! Also very nice graphics. As also in the first solution provided by Micheal, I recognized that you transformed the point coordnates (WGS 1984) to the polygon CRS, which is "ETRS_1989_TM06-Portugal" according to its prj-file. I tried it the other way around and it failed. Do you know any reason for that?
    – fabo
    Commented May 29, 2017 at 8:59
  • @fabo in general, those functions expect planar or projected CRS, that's why I choose transform the points to polygons CRS. The function st_intersects also expects planar coordinates. However, I tried transforming the polygons to the points CRS and It also worked.
    – Guz
    Commented May 29, 2017 at 11:38
2

I couldn't find the polygons file at the site you shared. I'm using this one for illustration purposes:

http://mapas.ine.pt/download/files/2011/municipios/BGRI2011_1106.zip

library(sp)
library(rgdal)
# fread is fast & I love data.table syntax
library(data.table)

# readOGR is great because it automatically reads the prj file
Lisboa = readOGR('.', 'BGRI2011_1106')
pts = fread('Points.csv')
ptsSPDF = SpatialPointsDataFrame(
  pts[ , cbind(lon, lat)],
  # I always use this CRS for Google-derived lat/lon
  data = pts, proj4string = CRS('+init=epsg:4326'),
  match.ID = FALSE
)

#convert
ptsSPDF = spTransform(ptsSPDF, proj4string(Lisboa))

#plot for illustration
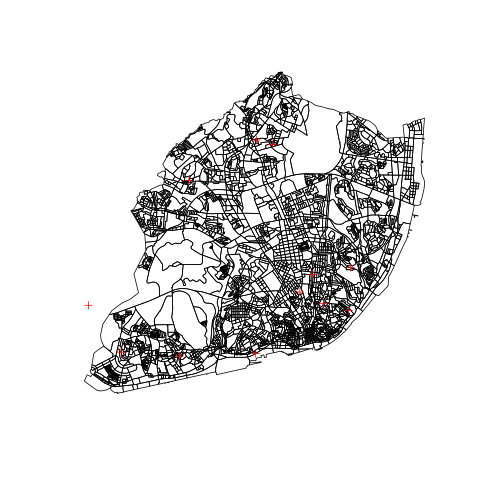
plot(Lisboa)
plot(ptsSPDF, add = TRUE, col = 'red')

overlaid points

2
  • Thank you very much for your help! I recognized that you transformed the point coordnates (WGS 1984) to the polygon CRS, which is "ETRS_1989_TM06-Portugal" according to its prj-file. Is there any reason for that? I think I got the corruption while trying it the other way around, transforming the polygon CRS (ETRS_1989) to the points' CRS (WGS 1984)...
    – fabo
    Commented May 29, 2017 at 8:57
  • @fabo I typically use the non-lat/lon CRS because distances have meaningful units... though it should work just as well the other direction Commented May 29, 2017 at 14:11

Your Answer

By clicking “Post Your Answer”, you agree to our terms of service and acknowledge you have read our privacy policy.

Not the answer you're looking for? Browse other questions tagged or ask your own question.