2

I started off with a SpatialPointsDataFrame, containing locations from animals wearing GPS loggers. Aside from the coordinates, the data frame also contains the animals' ID and a timestamp.

From this SpatialPointsDataFrame, I created lines that show the trajectory of each animal over the tracking period. I've used the following code:

spdf4tri#the SpatialPointsDataFrame

ids=unique(spdf4tri$id)
trajectory <- list()
 for (i in ids){ 
   spdf4bird<-subset(spdf4tri, id==i)
   birdtrajectory<-SpatialLines(list(Lines(list(Line(spdf4bird)), "id")))
   trajectory[[i]]<-birdtrajectory
   print(i)
 }

Now, I have a problem, because trajectory is of the class 'list'. I cannot figure out how to unlist it.

2
  • Use do.call with rbind Commented Jun 4, 2017 at 3:41
  • You might consider using trip, you need tr <- trip(spdf4tri, c("timestamp", "id")) and then as(tr, "SpatialLinesDataFrame") will give an multinestring object for each id. (trip is ponderously strict about the input data, and not so helpful and in need of an upgrade - happy to help if you want)
    – mdsumner
    Commented Jun 4, 2017 at 7:11

4 Answers 4

5

As I mentioned in my comment, you can use do.call for this. Here is an example.

First, add sp library and create a list with three SpatialLines objects (would work with Lines object as well).

library(sp)
sp.lines <- list()
  sp.lines[[1]] <- SpatialLines(list(Lines(list(Line(cbind(c(1,2,3),c(3,2,2)))),ID="a"))) 
  sp.lines[[2]] <- SpatialLines(list(Lines(list(Line(cbind(c(1,2,3)+0.5,c(3,2,2)+0.5))),ID="b"))) 
  sp.lines[[3]] <- SpatialLines(list(Lines(list(Line(cbind(c(1,2,3),c(1,1.5,1)))),ID="c"))) 

Now, use do.call with rbind to merge the lines into a single SpatialLines object.

merged.lines <- do.call(rbind, sp.lines)
  class(merged.lines)
  length(merged.lines)
  plot(merged.lines, col=1:3)
2

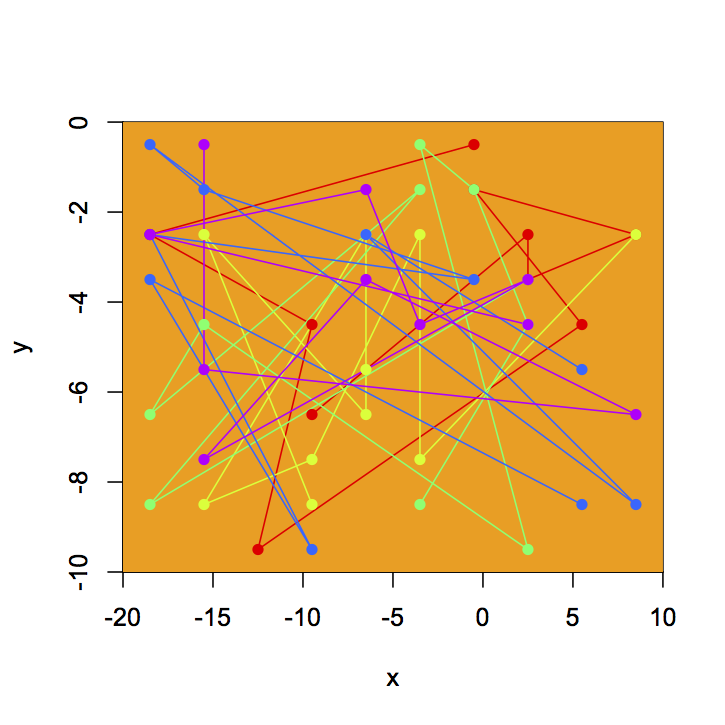
The clue is building the SpatialLines object later, once you have a list of Lines objects. The ID MUST be unique, otherwise all your Lines objects will have the same ID, and SpatialLines will throw an error.

I prepared this example code to illustrate:

 library(sp)
 library(raster) # need a raster to generate fake data
 library(dismo)  # I'm using the "randomPoints" function from dismo

 # first we need a canvas
 # we can start with an arbitrary extent
 ext <- extent(-20,10,-10,0)
 r <- raster(ext) # this is our raster object
 r[] <- 1 # let's fill it up with 1's

 indiv <- LETTERS[1:5] # let's say we have 5 individuals with data
 df <- data.frame()
 # we are generating 10 random points per "individual"
 for (i in 1:5)
      df <- rbind(df,randomPoints(r, 10))
 # you will get a warning about the projection, ignore that.

 # with this we can generate a SpatialPointsDataFrame
 spdf <- SpatialPointsDataFrame(
              coords=as.matrix(df), 
              data=data.frame(ind=sort(rep(indiv,10))))

 # now we loop for each individual 
 # and store "Lines" objects in a list
 trajectories <- list()
 for (i in 1:length(indiv))
         trajectories[[i]] <- Lines(list(Line(subset(spdf, ind == indiv[i]))), 
                                    ID=paste(i))
 # pay close attention on how the Lines object must be structured:
 # Lines(list(Line(spdf)), ID="unique string")

 # then we simply transform our trajectories list to SpatialLines
 splo <- SpatialLines(trajectories)

You can then visualize the data like this:

 image(r)
 plot(splo, add=T, col=rainbow(5))
 plot(spdf, add=T, pch=16, col=rainbow(5)[ spdf$ind ])

enter image description here

1

This is a list because your asked it to be a list. If your question is to have all your trajectories inside an object that is a SpatialLines, you should try this:

ids=unique(spdf4tri$id)
trajectory <- list()
 for (i in ids){ 
   spdf4bird <- subset(spdf4tri, id == i)
   trajectory[[i]] <- Lines(list(Line(spdf4bird)), "id")
   print(i)
 }
trajectory.sp <- SpatialLines(trajectory)

You have then one Lines for each animal. You can also add a dataframe if you have more information on the animals, for instance, with their id again:

trajectory.sp.data <- SpatialLinesDataFrame(trajectory.sp, 
    data = data.frame(id = ids))

Then you can plot with colour depending on id:

plot(trajectory.sp.data, col = rainbow(length(ids))[trajectory.sp.data$id])

I cannot test the script without your data, but this should work.
Is this what you were looking for ?

1
  • The id must be unique. Otherwise, SpatialLines will complain about it. So change that part to: Lines(list(Line(spdf4bird)), ID=paste(i))
    – ssanch
    Commented Jun 26, 2017 at 17:45
0

As an alternative: the rgeos package has a function gLineMerge to directly merge multiple lines from a SpatialLinesDataFrame to a single line:

library("rgeos")
merged_lines <- gLineMerge(your_spatial_data_frame)

Your Answer

By clicking “Post Your Answer”, you agree to our terms of service and acknowledge you have read our privacy policy.

Not the answer you're looking for? Browse other questions tagged or ask your own question.