11

I have two LiDAR files (.las), one is original let's say with X points. And the other is copy of the first .las file but with Y points, where Y is less than X.

Now, I want to compare the Digital Elevation Models (DEMs) of these two .las files and visualize how different they are.

I want to get information like RMSE, standard deviation, among other types of comparison.

Can you tell me software, and ways to get the comparison info?

0

4 Answers 4

8

How to compare two Digital Elevation Models (DEMs) in R.

#-------------------------------------------------------------------------
#Creating a reproducible example

library(raster)

  #simulating raster_1

  f = system.file("external/test.grd", package="raster")
  DEM_1 = raster(f)

  #simulating raster_2

  DEM_2 = DEM_1
  # replacing values from raster_1 to create a new raster sample (raster_2)
    DEM_2[(DEM_2>500 & DEM_2<900)] = 550
    DEM_2[(DEM_2>200 & DEM_2<300)] = 500

#-------------------------------------------------------------------------
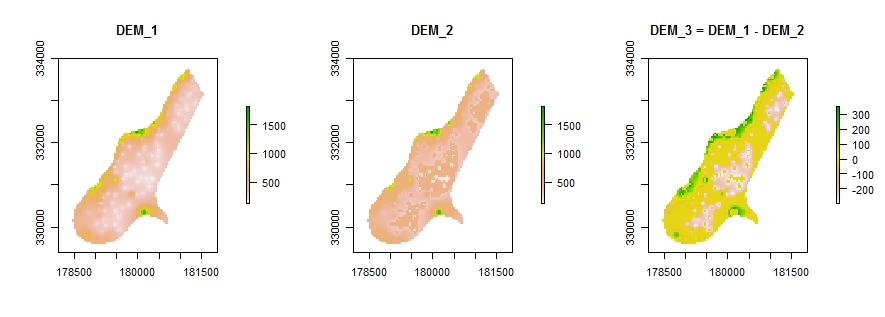
# Comparison 1 (DEM_3 resulted from subtracting DEM_2 from DEM_1)

  DEM_3 = DEM_1 - DEM_2

    par(mfrow=c(1,3))

    plot(DEM_1, main = "DEM_1")
    plot(DEM_2, main = "DEM_2")
    plot(DEM_3, main = "DEM_3 = DEM_1 - DEM_2")

      dev.off()
enter image description here

#-------------------------------------------------------------------------
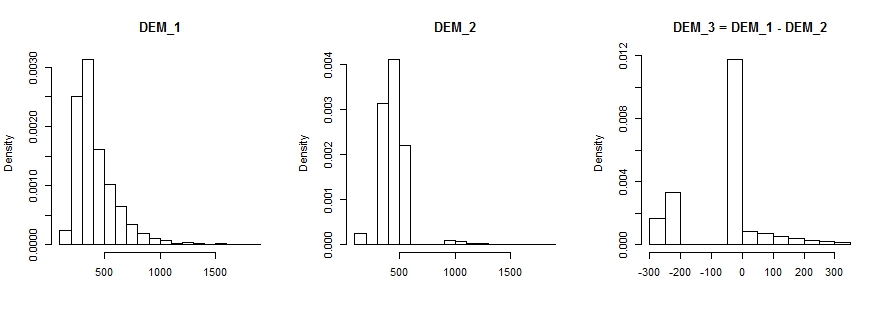
#Comparison 2 (histogram)

  hist(DEM_1, prob=T, main="DEM_1", xlab="")
  hist(DEM_2, prob=T, main="DEM_2", xlab="")
  hist(DEM_3, prob=T, main="DEM_3 = DEM_1 - DEM_2", xlab="")

    par(mfrow=c(1,1))

  standard_deviation = sd(c(as.matrix(DEM_3)),na.rm=T)

    dev.off()
enter image description here

#-------------------------------------------------------------------------
#comparison 3 (RMSE)

  library(hydroGOF)

  DEM_1_matrix = c(as.matrix(DEM_1))
  DEM_2_matrix = c(as.matrix(DEM_2))

  rmse = rmse(DEM_1_matrix,DEM_2_matrix)
  rmse
  [1] 135.3675 # this is the root mean squared error (RMSE) result.

See @whuber's answer on Comparing two TINs created using ArcGIS for Desktop? for a theoretical insight about this issue.

0
4

You can do this through the ESRI ArcGIS Geostatistical Analysis Extension - there is a section in the help on performing validation on subsets.

You could do the same through GRASS through the R interface. Tomislav Hengl describes in some detail how to do so in his book A Practical Guide to Geostatistical Mapping. It's open access, so the PDF is free to download.

1

As far as I know, RMSE is only stated during the making of the DEM, and not as an attribute for further refrence, so you'de have to "catch it" manually during the making of the DEM (that said, I never made a DEM from Lidar, only from other data).

If you want to see the differences between the DATA inside the two DEMS, I'd use cut/fill which is in the Spatial Analyst extension of ArcGIS (under "Surface Analysis"). The cut/fill shows you in a simple thematic map the changes between the DEM's.

0
1

I would do a simple DEM of difference. DEM2-DEM1. This will show all areas that are different and by how much.

Theres an image to a high res dem of difference on my website homepage. thadwester.com
Take a look at the colorful left image.