10

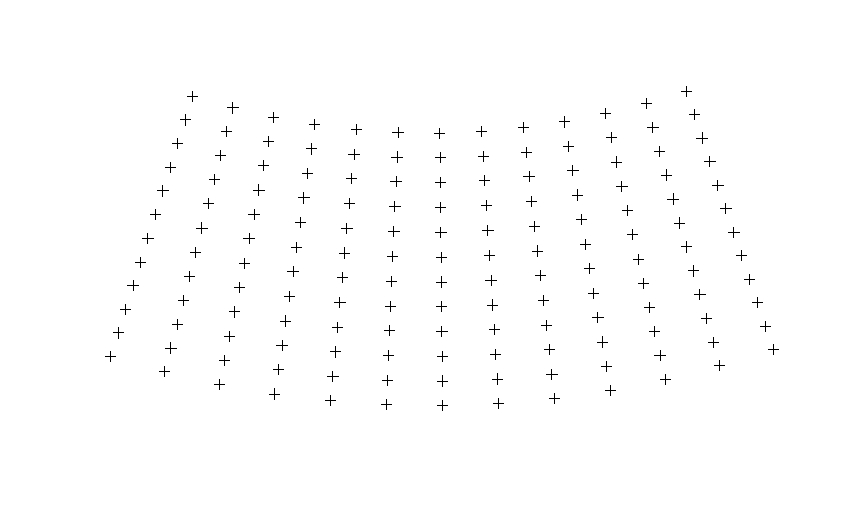
I am trying to recreate a map in R. I need 2 by 5 degree grid cells across the contiguous United States, but plotted in Albers Equal Area. The result is a grid with curved lines and slightly variable grid size, so I assume I cannot use a raster. I am able to reproduce the points, but not the grid. How do I make grid (polygon) lines for these points?

library(raster)

e <- as(raster::extent(-125, -65, 25, 49), "SpatialPolygons")
grd_lrg <- as.data.frame(makegrid(e, "regular", cellsize = c(5,2)))
names(grd_lrg)       <- c("X", "Y")
coordinates(grd_lrg) <- c("X", "Y")

# add projection information to the empty grid
proj4string(grd_lrg) <- CRS("+init=epsg:4326")

# transform to equal area Albers USGS
grd_lrg <- spTransform(grd_lrg, CRS("+init=epsg:5070"))

# plot it
plot(grd_lrg)

enter image description here

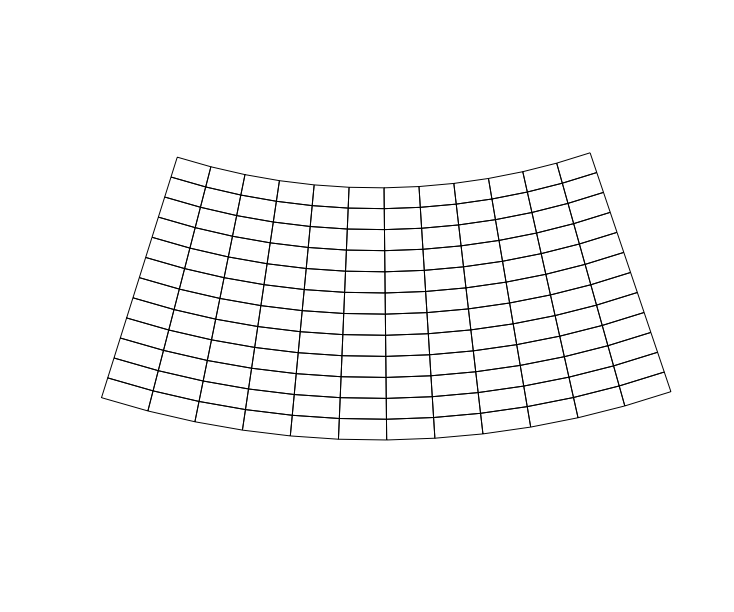
If I create the grid in Arc Map using Create Fishnet (Data Management) with the WGS84 coordinate system and import it into R, I get a nice looking grid: enter image description here

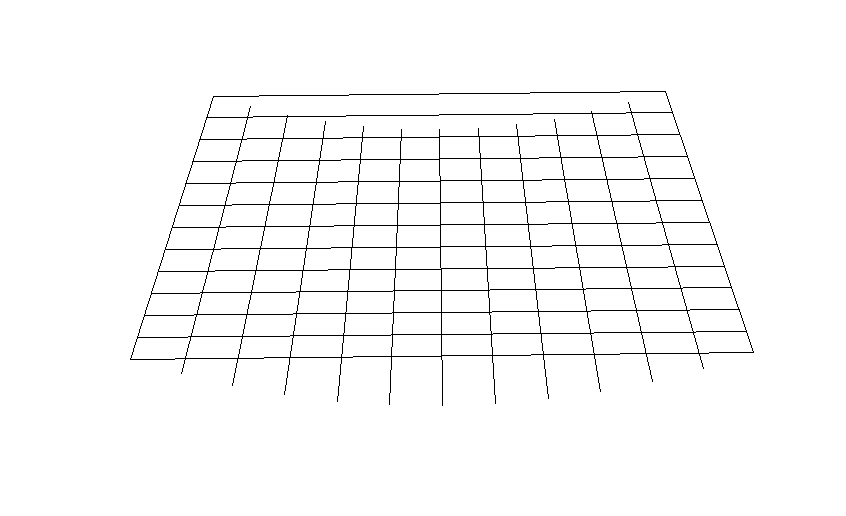
But converting it to Albers Equal Area with spTransform creates major distortions of the lines: enter image description here
So I am thinking I need to convert the points to Albers first and then add the lines?

2
  • That distortion appears to be because each line across the fishnet is defined only by its endpoints, so the transformed line is going to be a straight line between the transformed endpoints, rather than curved. Is there an option in the fishnet generator to make polygons rather than lines? Then each square would have four points that would transform better.
    – Spacedman
    Commented Mar 2, 2018 at 12:51
  • Yes, when I selected the polygon option (polyline is default in Arc Map create fishnet) and then transformed to Albers the result is good.
    – Katie
    Commented Mar 2, 2018 at 17:41

2 Answers 2

17

here is a solution using sf and sf::st_make_grid:

library(raster)
library(sf)

e <- as(raster::extent(-125, -65, 25, 49), "SpatialPolygons") %>% 
  st_as_sf()

grd_lrg <- st_make_grid(e, cellsize = c(5, 2)) %>%
  st_set_crs(4326) %>% 
  st_transform(5070)

plot(grd_lrg)

enter image description here

1
  • perhaps add 'library (dplyr)' to this answer?
    – yenats
    Commented Aug 18, 2020 at 10:56
10

You can make a long/lat raster and transform

library(raster)
r <- raster(ext = extent(-125, -65, 25, 49), res=c(5,2))
values(r) <- 1:ncell(r)
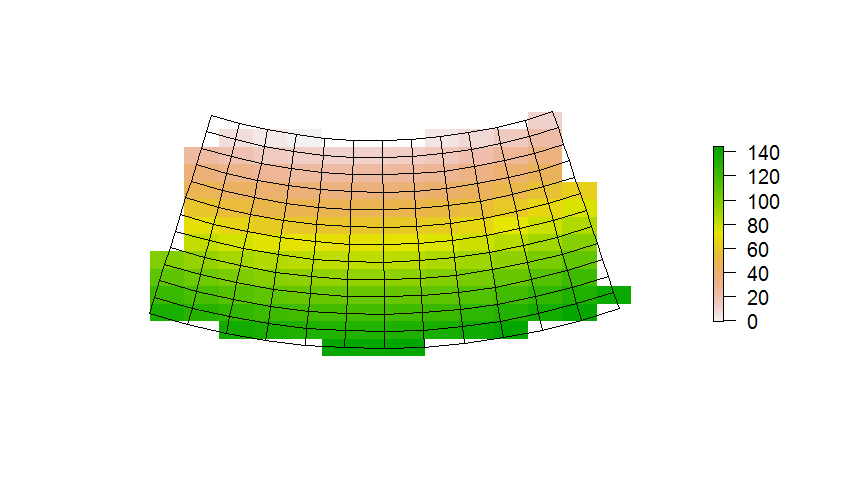
rA <- projectRaster(r, crs="+proj=aea +lat_1=29.5 +lat_2=45.5 +lat_0=23 +lon_0=-96 +x_0=0 +y_0=0 +datum=NAD83 +units=m")

But what you want seems to be

library(rgdal)
p <- rasterToPolygons(r) 
# or do:  p <- as(r, "SpatialPolygonsDataFrame")
pA <- spTransform(p, "+proj=aea +lat_1=29.5 +lat_2=45.5 +lat_0=23 +lon_0=-96 +x_0=0 +y_0=0 +datum=NAD83 +units=m")


plot(rA, axes=FALSE, box=FALSE)
plot(pA, add=TRUE)

enter image description here

2
  • ultimately I need to interpolate to the spatial polygons created with the above method. Are there interpolation methods that work with spatial polygons? I tried gstat::idw() but it returned an empty spatial polygons data frame.
    – Katie
    Commented Mar 2, 2018 at 0:06
  • 1
    You can interpolate to points, e.g. centroids(pA) . Or to a raster and then use extract(r, pA, fun=mean) . If that is not clear, you may want to set up another question with some example data. Commented Mar 2, 2018 at 1:14

Your Answer

By clicking “Post Your Answer”, you agree to our terms of service and acknowledge you have read our privacy policy.

Not the answer you're looking for? Browse other questions tagged or ask your own question.