1

Using ArcGis 10.4

I don't know if this is even possible, but I want to give it a try. The following problem: I have subcatchments (built from a DEM) and I have a river shape. This river shape is divided into 100m stretches with every stretch having many values (environmental data). Important: Within these 100m stretches there is no subdivision. If there are for example 10 found species, we dont know where. And that is fine, this is the accuracy we get.

Now, I need this data in my small catchments (sometimes the sum, sometimes STD or whatever), so I am using zonal statistics. But obviously the 100m stretches can be within more than one subcatchment. If I just transform it to a raster, then I get very wrong results, because every single pixel gets the whole values of the 100m stretch (hence, the sum values in the catchments get too large). My idea was to use "feature to point" to only have this value at ONE point. But then the problem occurs, that the middle point of a line is not necessarily in the catchment with the largest share of the 100m. (See picture, using the feature to point tool and then zonal statistics would mean that all values are assigned to the blue marked catchment, whereas in reality its very very unlikely all of the recorded data was found on that tiny stretch, but rather in the catchments left and right).

A little gerneralization is absolutely fine, since we can't really know where on that 100m stretches values are distributed anyway. But this way it seems very biased. I hope it gets clear what I mean. Any ideas how to improve that??

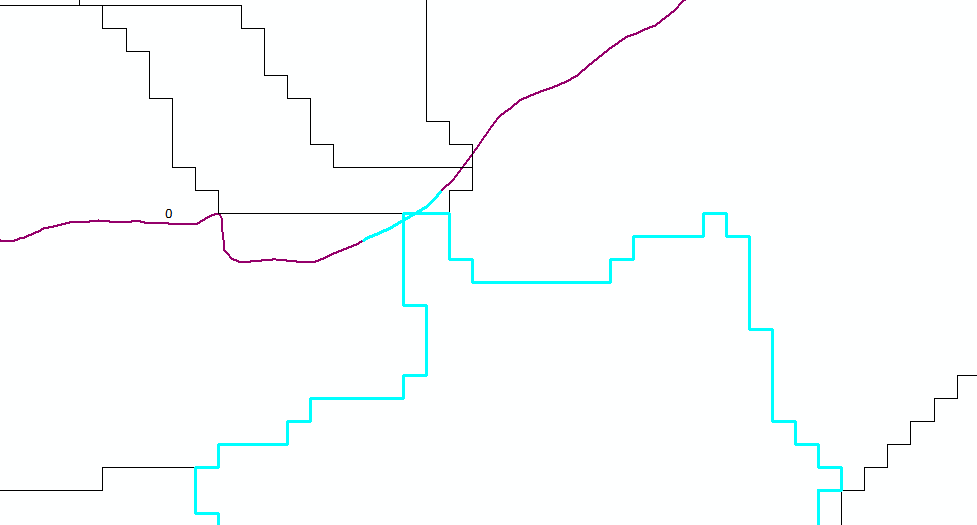
enter image description here

1
  • Find out count of cells under each reach and calculate value/count in reach table. Alternatively deal with vectors, i.e. convert catchments to polygons.
    – FelixIP
    Commented Apr 12, 2018 at 9:55

1 Answer 1

2

I agree with @FelixP that the best method would be based on vectors.

1) Convert your catchments to polygons (raster to polygon, conversion toolbox)

2) Use the intersect tool with your rivers and the catchments

3) Make sure that the lenght of you intersected lines are up to date (this is automatic in a geodatabase, but not in a shapefile)

4) compute the ratio between the old length (100 m) and the new length, multiplied by your environmental data (one new field for each environmental data): this is your expectation assuming an uniform distribution along your river segment.

5) use summary statistics with the ID of your catchment areas as a case field

3
  • Thank you Radouxju, I think that will be the way I have to go. My catchments are polygons anyway. Just the river I transformed into Raster to perform zonal statistics. Concerning 3), I dont really understand what you mean. How can they not be up to date? Thank you!
    – Canna
    Commented Apr 12, 2018 at 12:34
  • What I mean is that the shape_length field in, e.g., shapefiles is not dynamic. So if you cut a line in two, the attribute value "shape_length" will remain the same as before you cut it. In a personnal or in a file geodatabase, this field will be updated dynamically when you cut a line, so you need a copy of the length field in another field to keep the "old" length value.
    – radouxju
    Commented Apr 12, 2018 at 13:01
  • I see. Well in my case a new column with the new river length appeared and the old one was still there. Maybe because I work in a gdb. Thank you so much!!!
    – Canna
    Commented Apr 12, 2018 at 14:57

Your Answer

By clicking “Post Your Answer”, you agree to our terms of service and acknowledge you have read our privacy policy.

Not the answer you're looking for? Browse other questions tagged or ask your own question.