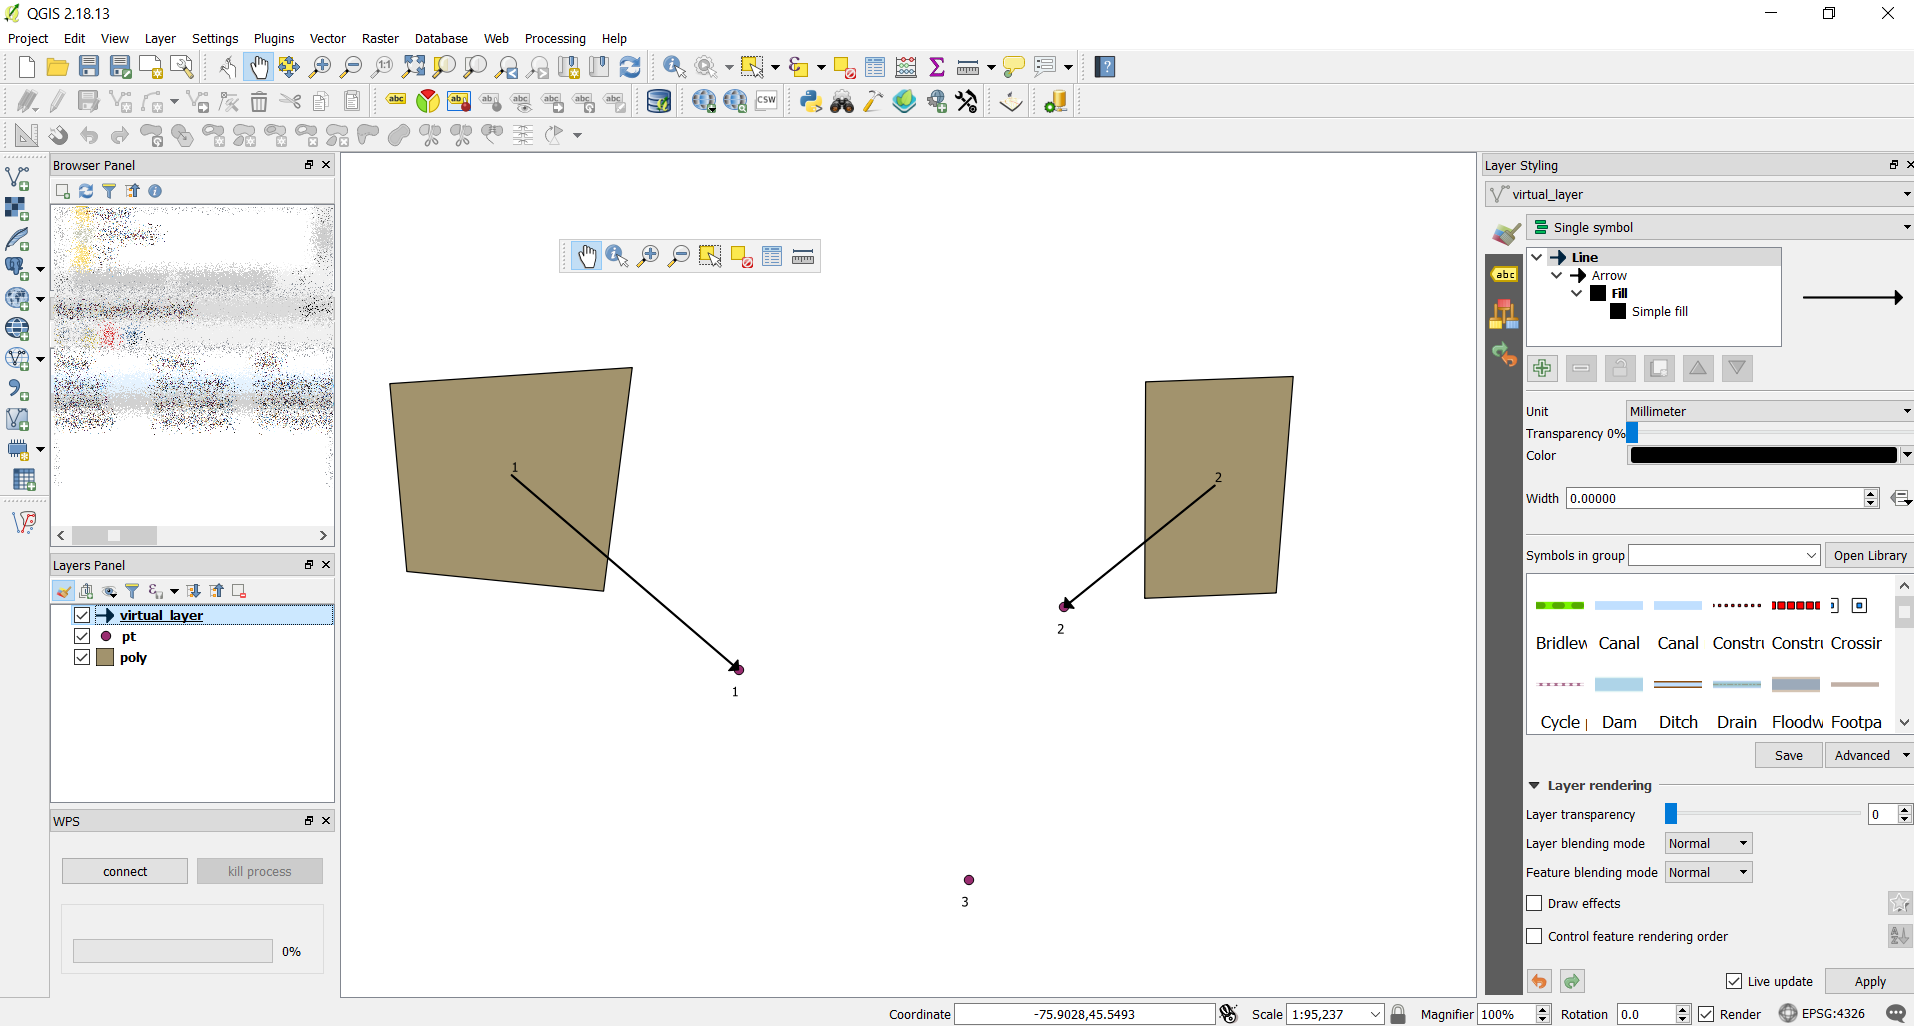
I would like to present in QGIS a graphical information I have in two vector layers, an arrow. One layer has catchemnt areas as polygons and the other has the outlet points. The catchment areas layer has the ID of the outlet points in its Atribute Tables. The question is how to present an arrow rom the centroid to the point.
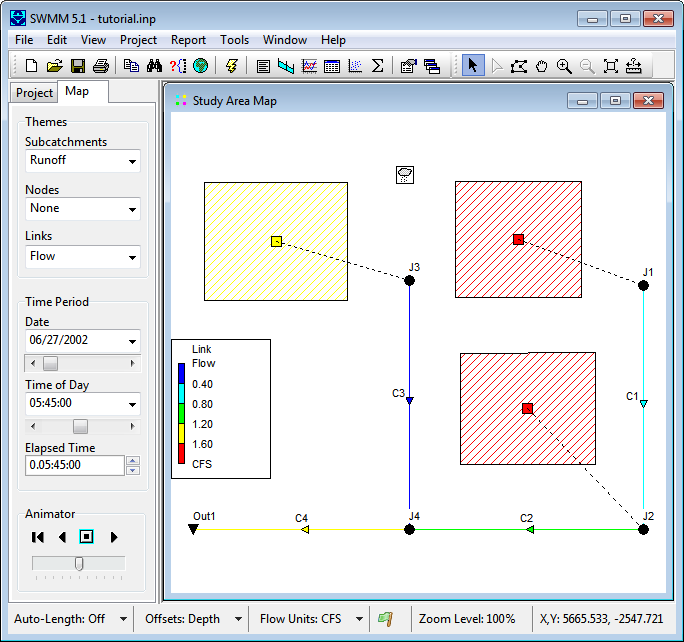
The background of the question is the SWMM model. In the picture below the yellow area points to node J3 and I want to draw that line.
In my case I have a subcatchment layer ('CatchmentAreas') with an attribute table like this:
fid Name    RainGage    Outlet
1   Sub_01  Rainfall    43
2   Sub_02  Rainfall    38
3   Sub_03  Rainfall    73
and a outlet layer ('Junctions') like this:
id  DESC    INV_ELEV
43  desc1   3.96
73  desc2   3.77
38  desc3   3.75
Outlet matches id


