2

I have the task to analyse ice types. I'm using Python to assist, no other programs is possible, unless I can export pure text dumps from said program, it's free and it can be fully automated and interfaced with Python.

Specifically, I'm using data from http://nsidc.org/data/g02171 (Canadian ice service), Western Arctic area. I understand the shapefile. The .prj file I don't fully understand. I realize it is parameter-information to show how the flattening / projection onto earth transformation is done. I've found http://docs.opengeospatial.org/is/12-063r5/12-063r5.html#49 but honestly, that is overwhelming.

What do I need to do to apply the inverse transformation?

I'm guessing I need information about the transformation, if so, where?

6
  • 2
    shape files are vector data, they don't have "pixels" unless they represent each pixel as a rectangular four-sided polygon...
    – Spacedman
    Commented Jun 19, 2018 at 21:17
  • Right. I have the bounding box for the whole shapefile structure, given in the nsidc.org/data/g02171 for example. When I open the shapefile in a viewer, it produces the lat and lon coordinates at mouseover, wherever in the image I am. Hovering over the points. How is this done? Is there enough information in the shapefile alone, for this? Commented Jun 19, 2018 at 21:22
  • 1
    The numerical values stored in the .shp file are values in a coordinate reference system specified in the .prj file. This is a "Lambert conformal conical" projection in metres. Code in your viewer can compute the reverse projection to get lat-long coordinates.
    – Spacedman
    Commented Jun 19, 2018 at 21:25
  • 2
    What are you using for a viewer? I recommend qgis (qgis.org) - you should maybe play with the data in that, read a bit more about gis data and come back when you have a specific question?
    – Spacedman
    Commented Jun 19, 2018 at 21:35
  • My questions where made more structured by PolyGeo. Do you perhaps have a link where I can read specifically about the practical side of the inverse transformations? Commented Jun 19, 2018 at 21:45

1 Answer 1

0

I'm not sure what you're asking.

Do you want to get Lat/Lon locations from your data?

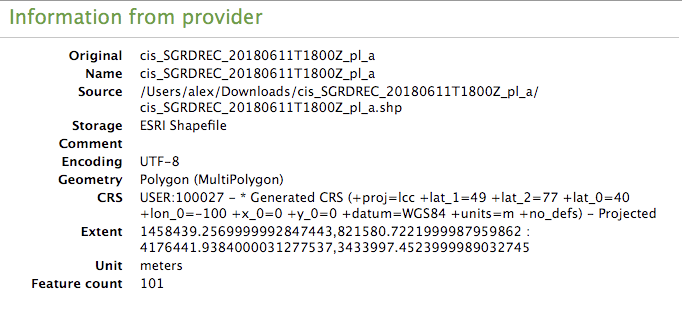
For your information, the Shapefile is defining a coordinate reference system, and I think it's a Lambert Conformal Conic projection, see the image here (from QGIS).

metadata

So, if you want to view it in standard Lat/Lon (i.e., the WGS84 unprojected coordinate reference system) you can do an 'on the fly' transformation in QGIS, or do an export of the Shapefile data in a new CRS. You're looking for EPSG:4326 as the code for the WGS84 CRS.

Once you either have an on the fly or permanent transformation happening, you will see coordinates in Lat/Lon.

1
  • 1
    Yes. That is exactly that. I want to be able to get the corresponding lat,lon from my data. I'm downloading images automatically from Copernicus open hub, I find the intersection of the shapefiles and the SAR image from Copernicus. However, the intersection I'm finding now is the SAR image and the bounding box of the Shapefile data (in lon,lat. it's specified on the CIS page). I need to find the exact lon,lat for every part(poly,points) of the shapefile data to know more precisely where the intersection occurs. I'm not interested in an intersection with the bounding box, only. Thanks Commented Jun 20, 2018 at 9:32

Your Answer

By clicking “Post Your Answer”, you agree to our terms of service and acknowledge you have read our privacy policy.

Not the answer you're looking for? Browse other questions tagged or ask your own question.