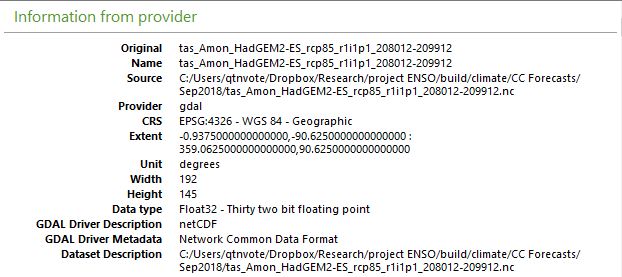
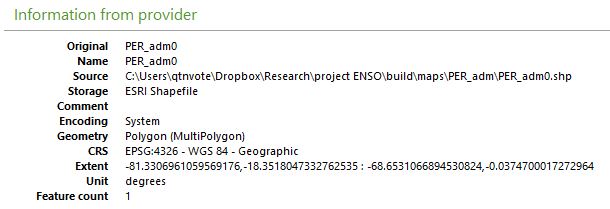
I've downloaded a raster with temperature projections by the Hadley Center (CIMP5) from here. It comes as a NetCDF file that I loaded onto QGIS 3.2.1. I then overlayed a shapefile with the borders of Peru, and it seems like the two maps are plotted separately:
How should I proceed to plot both the raster (NetCDF) and the shapefile on top of each other as they should? When I first loaded the raster in QGIS I got a message saying the CRS was undefined, but I could not for the life of me find what the appropriate CRS is for these files in the website.
Following @Vince's suggestion, here are the extents of each of the two layers:


