3

I am very new to CARTO and have very limited coding skills. I have a data set of points representing the centroid of zip codes. Each point has an associated average commute time.

It is relatively straightforward in CARTO to create a 15 minute drive-time buffer for all data points. But is there a way to make individual drive time buffers based on each point's average commute time?

3 Answers 3

3

To create different individual drive time buffers you can't use BUILDER, as it's not parametrized by a field. Instead, you need to use SQL directly to UPDATE your dataset with the geometries. So if your field for the commute time is commute_time then your query would look like the following queries. Mind that I'm putting the points as latitude/longitude to avoid having to use two tables.

I will do the process from scratch creating a table and adding some fake data, you should only have to apply the last query adapted to your scenario.

Create a testing table:

create table testing_driving_time (
  commute_time int,
  latitude numeric,
  longitude numeric
);

select cdb_cartodbfytable('testing_driving_time');

Add some testing data:

insert into testing_driving_time (commute_time, latitude, longitude) 
values
    (150,40.433449,-3.697554),
    (80,40.436455,-3.677598),
    (90,40.434315,-3.641356);

And finally compute the driving times using the Data Services API cdb_isochrone function:

update testing_driving_time
set the_geom = (
 select the_geom 
   from cdb_isochrone(
          CDB_LatLng(latitude,longitude), 
          'car', 
          ARRAY[commute_time]::integer[]
        )
  )
1

CARTO's Create Travel or Distance Buffers tutorial provides a guide which describes how to apply a buffer as follows:

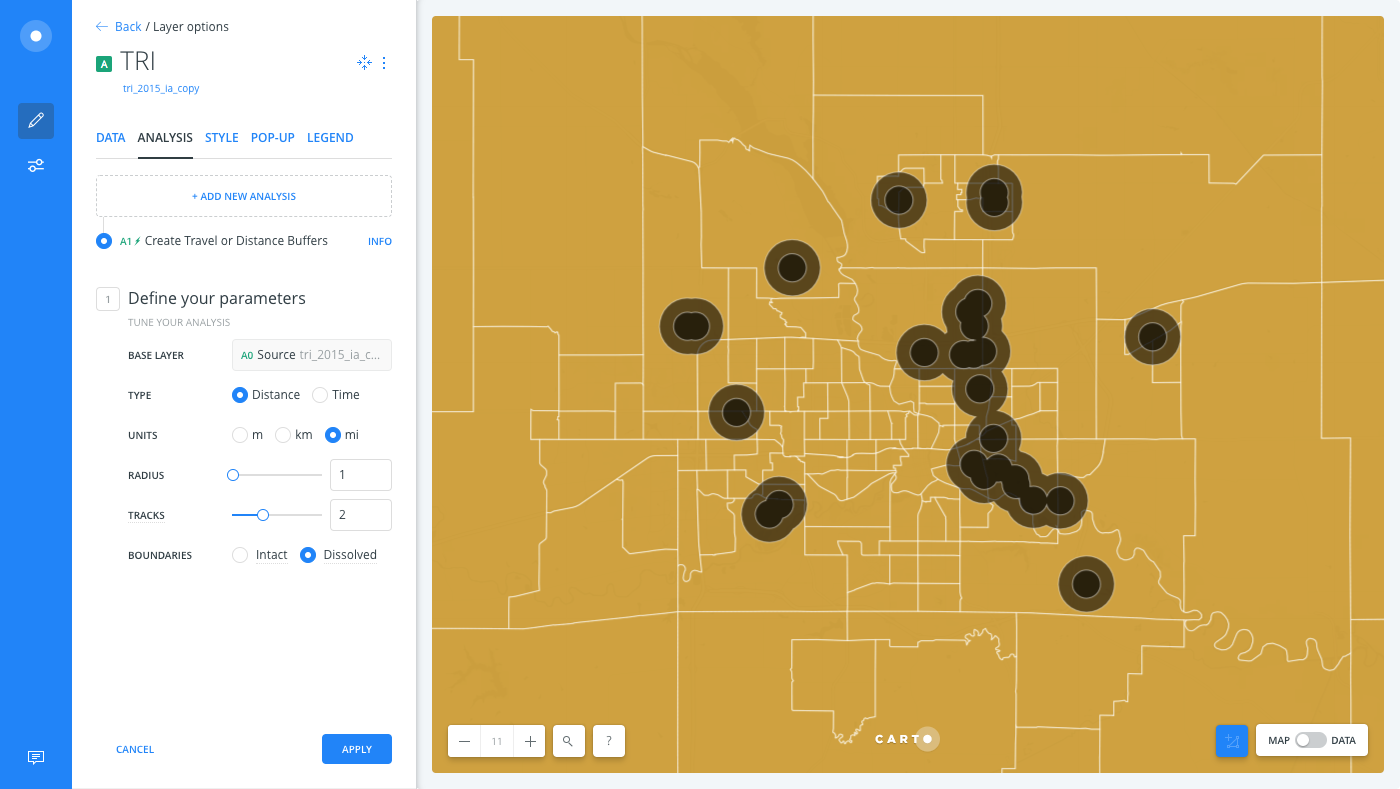
Import the template .carto file packaged from “Download resources” of this guide and create the map. Builder opens with TRI point data as the first map layer, and Census Tract polygons as the second map layer.

From the TRI map layer, click the ANALYSIS tab.
Click ADD ANALYSIS and apply the Create Travel or Distance Buffers option. This is the input layer used for creating the travel or distance buffers.

Select the following parameters for the analysis:
Distance as the TYPE
mi, for miles of UNITS
1 as the RADIUS
2 as the TRACTS. This parameter creates an isoline within the created buffer, dividing
the radius equally by the number of tracts.

Dissolved as the BOUNDARIES. This parameter enables you to define the polygon outlines as intact (keeps the original boundaries intact for overlapping buffers), or dissolved (dissolves the boundaries of overlapping buffers).

enter image description here

1
  • This answer is totally irrelevant to the original question. This tutorial only shows how to draw fixed distance buffers, not drive-time buffers, specifically drive-time buffers that vary by feature. @Jorge Sanz's answer is correct and works.
    – Kristen G.
    Commented May 19, 2020 at 2:26
1

In CARTO, you can style points as buffers based on individual column values (such as average of commuting time) using both CartoCSS (used in Builder and CARTO.js) and CARTO VL.

If you are using Builder or a CARTO.js application, you would need to apply first a query to convert your values. Why? Because we are going to pass to the CartoCSS marker-width property a pixel value and all need to fix on the screen. A query using PostgreSQL sqrt function should make the trick:

select 
  *, 
  sqrt(random() * 19 + 1)*5 as avg_time 
from 
  populated_places

This new avg_time column value should be assigned to the mentioned property. So you should use a CartoCSS code like this one:

#layer['mapnik::geometry_type'=1] {
  marker-width: [avg_time];
  marker-fill: ramp([avg_time], cartocolor(Sunset), quantiles(5));
  marker-fill-opacity: 0.9;
  marker-line-color: #FFFFFF;
  marker-line-width: 1;
  marker-line-opacity: 1;
  marker-type: ellipse;
  marker-allow-overlap: false;
}

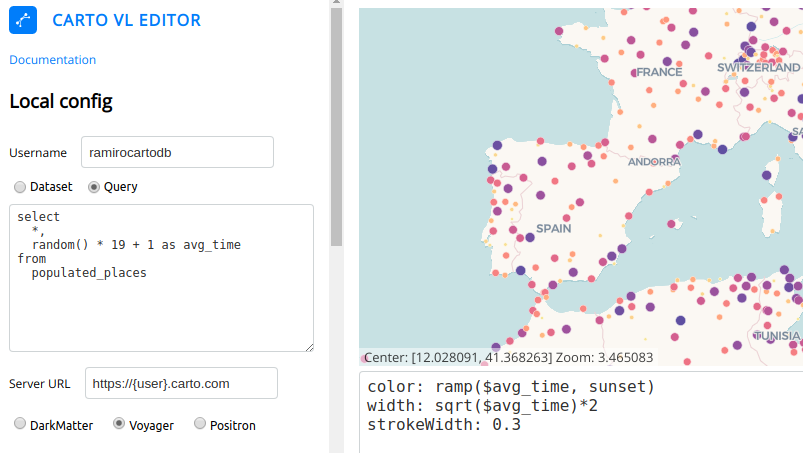
If you are using CARTO VL (CARTO's new vector library), on the other hand, the code would be much easier (and you do not need to change your data):

width: sqrt($avg_time)*2

A living example can be found here.

carto-vl-width

Your Answer

By clicking “Post Your Answer”, you agree to our terms of service and acknowledge you have read our privacy policy.

Not the answer you're looking for? Browse other questions tagged or ask your own question.