8

I made a geopackage to plan Aids-to-Navigation for maritime environments. In my database I have a few fields that describe the character of the lights that are to be placed on the planned A-to-N's. These are the fields used in the S-57 standard.

e.g.: A south cardinal bouy (it' s a type of AtoN) has a standard lightcharacter: 6 quick flashes + one long flash in a total period of 15 seconds. this is coded as (italic text not in database:

LITCHR: 25 - Quickflash + Longflash;

SIGPER: 15 - 15 seconds;

SIGGRP: (6+1);

SIGSEQ: 0.5(0.5)0.5(0.5)0.5(0.5)0.5(0.5)0.5(0.5)0.5(2.5)3(4)

The SIGSEQ (signal sequence) is the total flashsequence of the light with the format: light(eclipse), so 0.5(0.5) is half a second lit, half a second dark. The total amount of the SIGSEQ should add up to be as much as the SIGPER.

Is is possible in QGIS to make a SVG marker blink as the intended lightcharacter?! If yes I would like to know where I have to look to make this happen.

SVG marker i want to make blink view of project

4
  • 1
    Not as a core feature, but maybe there's a plugin. For example, MMQGIS says it does "simple animation." Or maybe you can creatively use QVisualize plugin, which displays features one-by-one, with a time delay that you specify. There's also QGIS Full Motion Video, which "allows to analyze, visualize and process videos inside the QGIS environment."
    – csk
    Commented Jan 28, 2019 at 21:06
  • 2
    Indeed very interesting question. You could try using data defined override and add something like this: Case When second(now()) > 0 AND second(now()) <= 30 Then '#990000' When second(now()) > 30 AND second(now()) <= 60 Then '#00FF00' end. I will take a look at what is possible with this...
    – MrXsquared
    Commented Jan 28, 2019 at 21:08
  • 1
    I have no idea if QGIS can display SMIL in SVG files, but it might be something to look into as the animations would be internal to the symbols themselves and could therefore be set as rule-based symbols, no plugin needed.
    – Gabriel
    Commented Jan 28, 2019 at 21:18
  • 1
    possible with python. a blog from 2014 so it's been around for a few years. python 3 syntax for qgis3 would be needed to adapt all of that for your needs nathanw.net/2014/10/29/animated-qgis-map-canvas-item
    – SaultDon
    Commented Jan 28, 2019 at 21:43

2 Answers 2

10

I played around for a bit with @MrXsquared's idea and there is a way to do it with the expression builder. I have tried various ways of defining the patterns and I was successful even for irregular ones, although I'm not 100% satisfied. Another issue is that for huge layers with large numbers of features, this is probably not viable to refresh at 10hz...

Simple patterns like Flashing and Occulting are easy to write, but the particular example you used, a cardinal south buoy, gets tedious real quick. I'll get to that one further below.

Bear in mind I assume the SVGs you use can have their basic parameters set inside QGIS (outline color, outline weight, fill color). Check here if you'd like to do that.

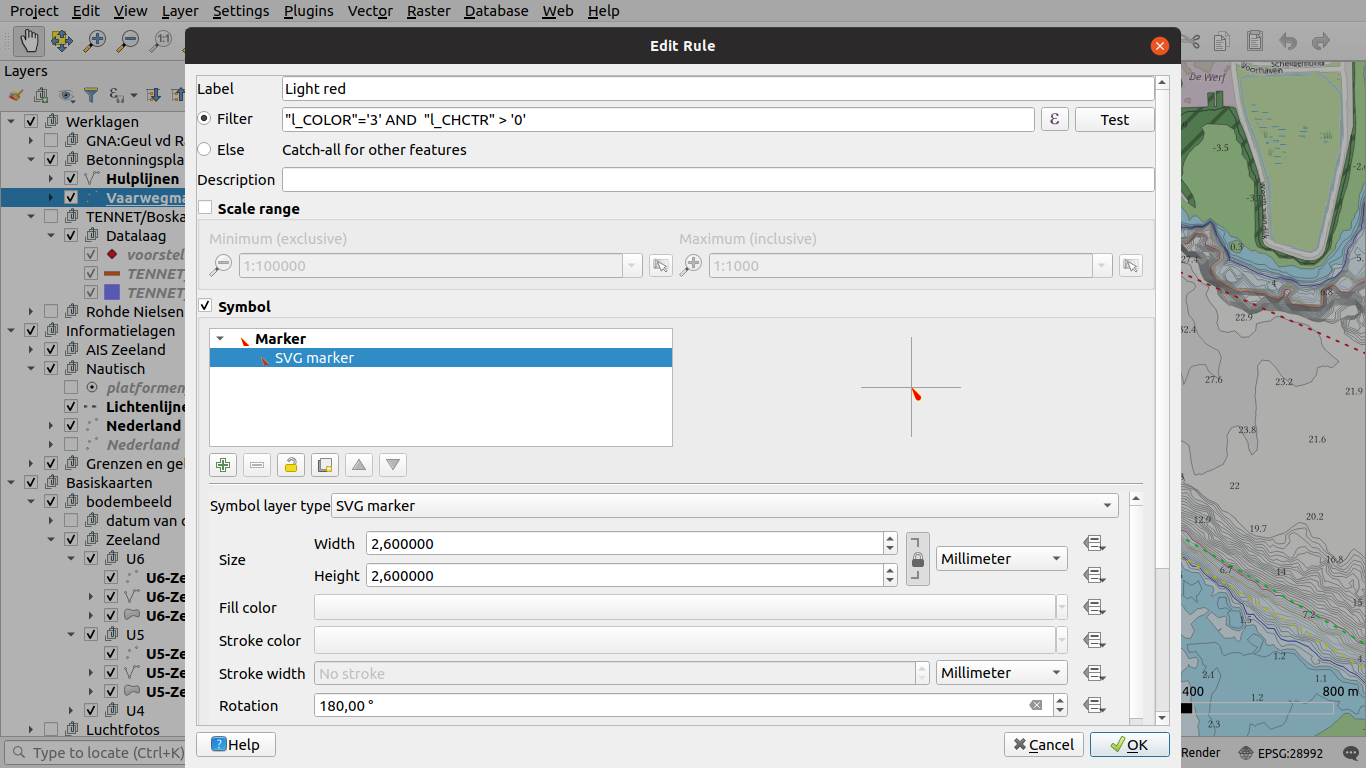
To get flashing signals, first set the stage by using Rule-based symbology on your layer. Edit the rules and go to the marker section, highlighting the symbol layer and going to the fill color expression builder. As an example, the rules for flashing and occulting are basically the same, with the alpha channel values reversed:

  • Flashing: if(second(now()) % 5,'#00FF0000','#FFFF0000')
  • Occulting: if(second(now()) % 5,'#FFFF0000','#00FF0000')

Symbols with the above rules will flash/occult red, 12 times per minute. Just edit the hex color values and modulo for the various lights in new rules.

Then go to Layer properties | Rendering and set the refresh layer at interval to 0.10, ticking the checkbox. After applying the changes, your symbols should be flashing in the map canvas.

Now for the Q(6) + LFl. 15s example, I haven't found a way to simplify the expression. I was able to make it work by explicitly specifying on which map canvas updates I wanted the alpha to be opaque or transparent. It wouldn't have made for a particularly long string if the flashing hadn't been under a second, but now I had to tell QGIS every 0.1 second if it needed to be lit, over the course of 1 minute. That's a lot of values. I just built the first 15s pattern in Excel, transposed it +15 3 more times, concatenated everything in 1 cell and copy-pasted it in my rule, which looks like this:

  • Q(6) + LFl. 15s: if(round(format_date(now(),'s.z'), 1) IN (0,0.1,0.2,0.3,0.4,0.5,1,1.1,1.2,1.3,1.4,1.5,2,2.1,2.2,2.3,2.4,2.5,3,3.1,3.2,3.3,3.4,3.5,4,4.1,4.2,4.3,4.4,4.5,5,5.1,5.2,5.3,5.4,5.5,8,8.1,8.2,8.3,8.4,8.5,8.6,8.7,8.8,8.9,9,9.1,9.2,9.3,9.4,9.5,9.6,9.7,9.8,9.9,10,10.1,10.2,10.3,10.4,10.5,15,15.1,15.2,15.3,15.4,15.5,16,16.1,16.2,16.3,16.4,16.5,17,17.1,17.2,17.3,17.4,17.5,18,18.1,18.2,18.3,18.4,18.5,19,19.1,19.2,19.3,19.4,19.5,20,20.1,20.2,20.3,20.4,20.5,23,23.1,23.2,23.3,23.4,23.5,23.6,23.7,23.8,23.9,24,24.1,24.2,24.3,24.4,24.5,24.6,24.7,24.8,24.9,25,25.1,25.2,25.3,25.4,25.5,30,30.1,30.2,30.3,30.4,30.5,31,31.1,31.2,31.3,31.4,31.5,32,32.1,32.2,32.3,32.4,32.5,33,33.1,33.2,33.3,33.4,33.5,34,34.1,34.2,34.3,34.4,34.5,35,35.1,35.2,35.3,35.4,35.5,38,38.1,38.2,38.3,38.4,38.5,38.6,38.7,38.8,38.9,39,39.1,39.2,39.3,39.4,39.5,39.6,39.7,39.8,39.9,40,40.1,40.2,40.3,40.4,40.5,45,45.1,45.2,45.3,45.4,45.5,46,46.1,46.2,46.3,46.4,46.5,47,47.1,47.2,47.3,47.4,47.5,48,48.1,48.2,48.3,48.4,48.5,49,49.1,49.2,49.3,49.4,49.5,50,50.1,50.2,50.3,50.4,50.5,53,53.1,53.2,53.3,53.4,53.5,53.6,53.7,53.8,53.9,54,54.1,54.2,54.3,54.4,54.5,54.6,54.7,54.8,54.9,55,55.1,55.2,55.3,55.4,55.5),'#FFFFFFFF','#00FFFFFF')

This is terribly ugly, I know, but it works, flashes white on the specified pattern. If you're more comfortable with Python than I am, this can probably be circumvented in the function editor. Here's what some dummy data looks like on my canvas:

enter image description here

10
  • Was ending up with the same thing. But I failed changing the refresh rate of map canvas. Now QGIS crashes everytime I hit OK button in settings menu (no matter if I change settings or not). So I want to add this warning: Do not change refresh rate in Settings --> Options but as described in this answer in Layer Properties; This works just fine.
    – MrXsquared
    Commented Jan 28, 2019 at 21:55
  • 2
    To shorten up things you can use if(second(now()) % 5,'red','blue')
    – MrXsquared
    Commented Jan 28, 2019 at 22:04
  • 1
    Indeed. Only expression available in QGIS that works with milliseconds is epoch(). But not sure yet how an expression using this could look like in the end. Maybe this could be done with a custom python script in function editor.
    – MrXsquared
    Commented Jan 28, 2019 at 22:18
  • 1
    Using if(epoch(now()) % 5,'red','blue') and setting refresh rate to 0,05 seems to "work", but it also seems like QGIS comes to its limit as the blinking is no longer consistently. Wouldnt really recommend. Edit: should be % 500 i think. But this seems to not work at all..
    – MrXsquared
    Commented Jan 28, 2019 at 22:29
  • 1
    to_real(format_date(now(),'s.z')) returns the milliseconds, but I'm unable to get the symbology to work with it. Needs more testing.
    – Gabriel
    Commented Jan 28, 2019 at 23:25
3

The solution

To create the blinking pattern you asked for, activate the new Animated Marker (available since QGIS 3.26). Then use data driven override for Enable symbol layer with the following expression (explanation below):

Result, realizing your pattern: 6 quick flashes + one long flash in a total period of 15 seconds; the numbers from 0 to 999 show milliseconds, but framerate is adapted to result in a 15 seconds loop: enter image description here

array_sum (
    with_variable (
    'range',
    array_cat (generate_series (0,11), array(16,22,30)),
    with_variable (
        'milliseconds',
        right (datetime_from_epoch (@symbol_frame ), 3),
    array_foreach (
        generate_series (0,14,2),
        if (
            @milliseconds >=round(@range[@element]*100/3) and 
            @milliseconds <= round(@range[@element+1] *100/3 ),
            1,
            0
        )))))

1. Create blinking pattern and store it as variable @range

You have the blinking pattern (bold=on, italic=off) like this (first row). Muliply it by 2 to get whole numbers (2nd row). If you add the cummulatively add these numers, you get the following pattern with the timecode when the light goes on or off (3rd row):

enter image description here

So a first challange is to create an array with this irregular pattern (row 3: 1 to 30). Do it in two steps - for numbers 1 to 11 (regular part) and the last three numbers (irregular part), then combine both arrays using array_cat(). The following expression generates this pattern (starting in fact with 0 where the animation starts):

array_cat (generate_series (0,11), array(16,22,30))

output: [ 0, 1, 2, 3, 4, 5, 6, 7, 8, 9, 10, 11, 16, 22, 30 ]

2. Create values of 0 to 999 as variable @milliseconds

This values represent milliseconds to be able to control blinking intervals shorter then 1 second. This is a bit tricky as the only QGIS expressions that work with milliseconds are datetime_from_epoch() and epoch() (thanks for the hint @MrXsquared)

So to crete these values, use this expression that retrieves only the last 3 digits of the epoch datetime: right (datetime_from_epoch (@symbol_frame), 3)

output: a number from 0 to 999 that changes each time the frame is updated (depending on framerate defined).

3. Check if current @milliseconds value is in the range of the "light on" timecode.

To do so, we take the first value of the array from step 1 (index 0 using index operator)

  • So from startpoint (0 milliseconds) to this first value (index 0): light on (timecode 0 to 1)
  • At this first value, light turns off until the second value (index 1): light off (timecode 1 to 2)
  • From second value (index 1) to third value (index 2): light on (timecode 2 to 3)

So light starts at even index numbers from the array, as follows: 0, 2, 4, 6 etc. Light turns off at uneven index number from the array: 1, 3, 5, 7 etc.

So we iterate (array_foreach()) through the array but only take every second element for start time, so we create another array for the iteration with only even numbers from 0 to 14 like this: generate_series (0,14,2)

Now we check if the current @milliseconds value is inside one of the ranges (0 to 1, 2 to 3, 4 to 5 etc.). We convert these timecodes to milliseconds, so instead of 0 to 30 we get 0 to 1000 (muiltiply by 100, divide by 3).

Now, we have all the necessary values together to check: get start of blinking time with @range[@element] and end of it with @range[@element+1]. Include it in an if() clause and assign values of 1/0 for true (@milliseconds falls inside one of the blinking intervals) or false (@milliseconds falls not inside any interval).

if (
    @milliseconds >=round(@range[@element]*100/3) and 
    @milliseconds <= round(@range[@element+1] *100/3 ),
    1,
    0
)

We get an array consisting of values 0 (most) and 1 (in case @milliseconds is in the range). Create the array's sum and we're finally done!

If you now set the framerate to 66.66 fps, you get the pattern to blink in a total period of 15 seconds. Why 66.66 frame per second? Well, we have 1000 milliseconds (milleseconds to be able to have time values under 1 second) which we will want to rund within 15 seconds, so 1000 / 15 = 66.66 frames per second.

It can be that QGIS, depending on the hardware, is unable to cope with this (high) framrate and to redraw/render the whole canvas 67 time a second. You can change the values accordingly to use a smaller framerate, e.g. ten times less (6.66 fps) and using 1/100 seconds (instead of milliseconds, 1/1000 second). To do so, change expression as follows:

  • Line 7 (definition of variable @milliesconds): use 2 (instead of 3) rightmost characters of the string, in fact getting 0.01 seconds instead of 0.001:

    right (datetime_from_epoch (@symbol_frame ), 2)

  • Lines 11 and 12: multiply by 10 (instead of 100)

    @milliseconds >=round(@range[@element]*10/3

Like this, you get the same animation pattern in the same time, but with 10 times less frames to spare the hardware/rendering.

2
  • This is an excellent explanation, but it is not clear to me why the framerate must be 66.66 FPS. By doing so, in QGIS there's a strange behaviour in which other, totally unrelated layers, blink as well.
    – Trikelians
    Commented Nov 9, 2023 at 11:25
  • See updated solution, at the very bottom, with reducing framerate. Maybe 66.55 fps is too much to render for your hardware? So see how to reduce framerate to get the same animation pattern within the same time.
    – Babel
    Commented Nov 9, 2023 at 14:17

Your Answer

By clicking “Post Your Answer”, you agree to our terms of service and acknowledge you have read our privacy policy.

Not the answer you're looking for? Browse other questions tagged or ask your own question.