3

I have two raster datasets (a World Soil Map and Global Horizontal Irradiance), which I merged together in QGIS in order to get values of both channels for every pixel.

The Soil Map has 30 soil type classes and the GHI raster has been restricted to 16 classes.

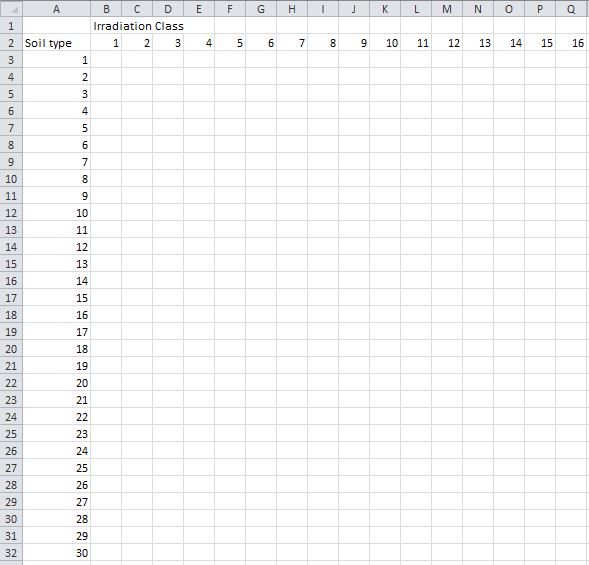
I would like to get an overview of the frequency of each combination (30x16).

enter image description here

The next example shows the values of a random point. As the upper table is simplified, here you get an actual point of the raster: Channel 1 shows the soil type (57 represents Gleysols) and channel 2 gives the value of irradiance (Long-term average of daily sum <1752 kWh/m^2):

enter image description here

Do you have any recommendations how to process a frequency matrix of this? I also want to do this using vector data and compare the results. (My R and Python-Skills are rather limited, but I'm willing to learn)

1
  • This sounds like a cross tabulation
    – Zipper1365
    Commented Nov 9, 2019 at 12:54

1 Answer 1

1

The rasterized WSR Soiltype image had a very little aberration (after rasterizing with the grid extent of the GHI map, it had one more column and row and so didn't work for the tool which gives the answer for my request).

As the grids were synchronized, the SAGA Zonal Raster Statistics gives out a table with the count of each combination of two raster bands:

GHI Class | SoilType | Count UCU

This can be exported as csv and imported elsewhere to get histograms and matrices.

An other tool which might be useful (which I didn't process successfully yet) is SAGA’s "Cross-classification and tabulation”.

Your Answer

By clicking “Post Your Answer”, you agree to our terms of service and acknowledge you have read our privacy policy.

Not the answer you're looking for? Browse other questions tagged or ask your own question.