7

I have rows of respondents with their residential census tract polygon and am trying to generate first-order aggregated areas. Meaning I want a given respondent’s census tract polygon to be merged with all the polygons touching its borders. A separate file contains all possible US census tract polygons.

st_union seems appropriate only for aggregating together ALL interesting polygons to a single mass polygon.

Using st_intersection and then aggregating by row ID seems viable, but I’m unsure how to do the aggregation procedure.

I hope to remain within the sf environment.

Similar threads I’ve quered: Dissolve only overlapping polygons in R

Joining polygons in R

3 Answers 3

7

If I understood correctly, given a polygon layer with N features, what you need is to generate a new set of N geometries where each geometry is the result of a union with it's neighbors.

A straightforward solution can be to use a for loop going over the 1:N polygons, applying st_union on the current set of neighbors for polygon i in each "round", as in -

geom = list()
for(i in 1:nrow(pol)) {
  geom[[i]] = st_union(pol[pol[i, ], ])
}
geom = do.call(c, geom)

Where pol is the original layer and geom is the new set of merged geometries.

Here is a reproducible example using the nc dataset -

library(sf)

# Sample data
nc = st_read(system.file("shape/nc.shp", package="sf"))

# Plot 1
plot(st_geometry(nc))
plot(st_geometry(nc[25, ]), add = TRUE, col = "red")

# Merging each polygon with its neighbors
geom = list()
for(i in 1:nrow(nc)) {
  geom[[i]] = st_union(nc[nc[i, ], ])
}
geom = do.call(c, geom)

# Plot 2
plot(geom)
plot(geom[25], add = TRUE, col = "red")

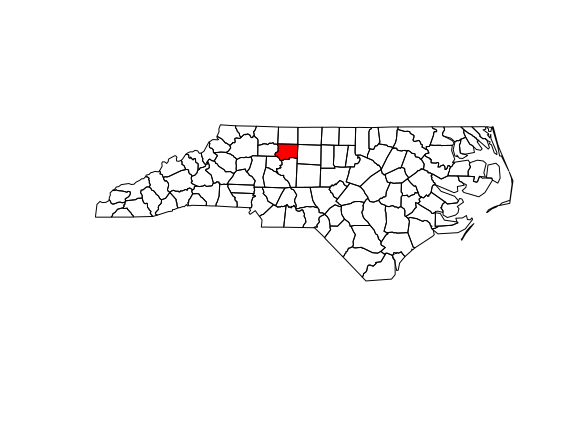
Plot 1 shows the original layer, with a specific polygon n=25 shown in red -

enter image description here

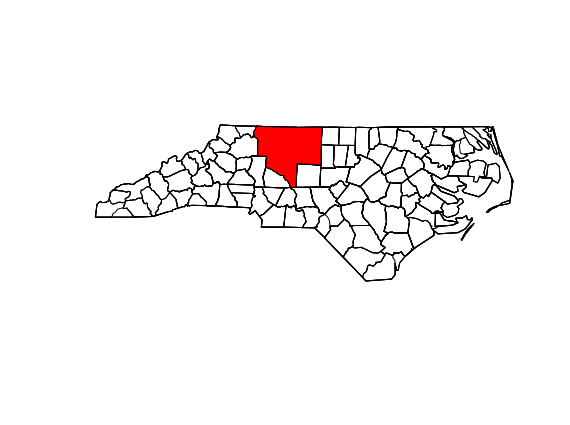
Plot 2 shows the layer with the new geometries, where the new polygon n=25 is merged with its neighbors -

enter image description here

2
  • Your pol is not defined (as in, running your code produces an error). Commented Oct 2, 2019 at 1:40
  • 1
    The first code section is to illustrate the concept, it's not reproducible. The second code section is a specific (reproducible) example. Commented Oct 2, 2019 at 5:43
6

After hours of trying, I made a simple function that merges units by some grouping variable, which is usually what one wants to do.

> library(sf)
> library(plyr)
> #load nc data
> nc = st_read(system.file("shape/nc.shp", package="sf"))
Reading layer `nc' from data source `/home/emil/R/x86_64-pc-linux-gnu-library/3.6/sf/shape/nc.shp' using driver `ESRI Shapefile'
Simple feature collection with 100 features and 14 fields
geometry type:  MULTIPOLYGON
dimension:      XY
bbox:           xmin: -84.32385 ymin: 33.88199 xmax: -75.45698 ymax: 36.58965
epsg (SRID):    4267
proj4string:    +proj=longlat +datum=NAD27 +no_defs
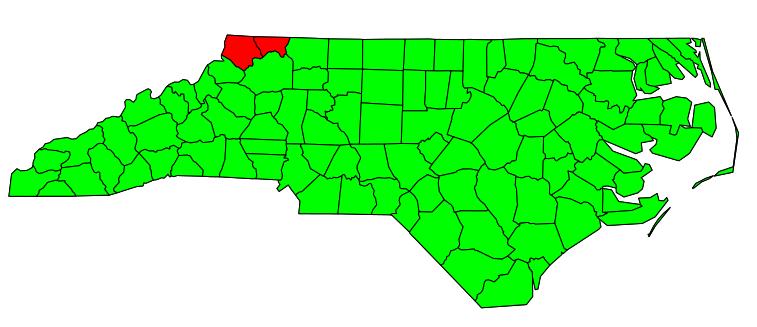
> #what we want to merge
> plot(st_geometry(nc))
> plot(st_geometry(nc[1:2, ]), add = TRUE, col = "red")
> plot(st_geometry(nc[-(1:2), ]), add = TRUE, col = "green")

enter image description here

> #merge units as desired by group variable
> st_union_by = function(geo, group) {
+   # browser()
+   geo
+   group
+ 
+   y2 = list()
+   #loop over by groups and merge units
+   for (i in unique(group)) {
+     #which units
+     z = geo[group == i]
+ 
+     #merge
+     y = Reduce(st_union, z)
+     y2[[i]] = y
+   }
+ 
+   st_sfc(y2)
+ }
> #add grouping variable
> nc$x = c(rep(1, 2), rep(2, 98))
> nc$x
  [1] 1 1 2 2 2 2 2 2 2 2 2 2 2 2 2 2 2 2 2 2 2 2 2 2 2 2 2 2 2 2 2 2 2 2 2 2 2 2 2 2 2 2 2 2 2 2 2 2 2 2 2 2 2 2 2 2 2 2 2 2 2 2 2 2 2 2 2
 [68] 2 2 2 2 2 2 2 2 2 2 2 2 2 2 2 2 2 2 2 2 2 2 2 2 2 2 2 2 2 2 2 2 2
> #merge
> nc2_geo = st_union_by(nc$geometry, nc$x)
> #plot results
> plot(nc2_geo)
> plot(st_geometry(nc2_geo[1]), add = TRUE, col = "red")
> plot(st_geometry(nc2_geo[2]), add = TRUE, col = "green")

enter image description here

> #make a new sf df
> nc2 = plyr::ddply(nc, "x", function(d) {
+   data.frame(
+     AREA = sum(d$AREA)
+   )
+ })
> #make sf df like originally
> st_geometry(nc2) = nc2_geo
> nc2
Simple feature collection with 2 features and 2 fields
geometry type:  GEOMETRY
dimension:      XY
bbox:           xmin: -84.32385 ymin: 33.88199 xmax: -75.45698 ymax: 36.58965
epsg (SRID):    NA
proj4string:    NA
  x   AREA                       geometry
1 1  0.175 POLYGON ((-81.47276 36.2343...
2 2 12.451 MULTIPOLYGON (((-81.76536 3...
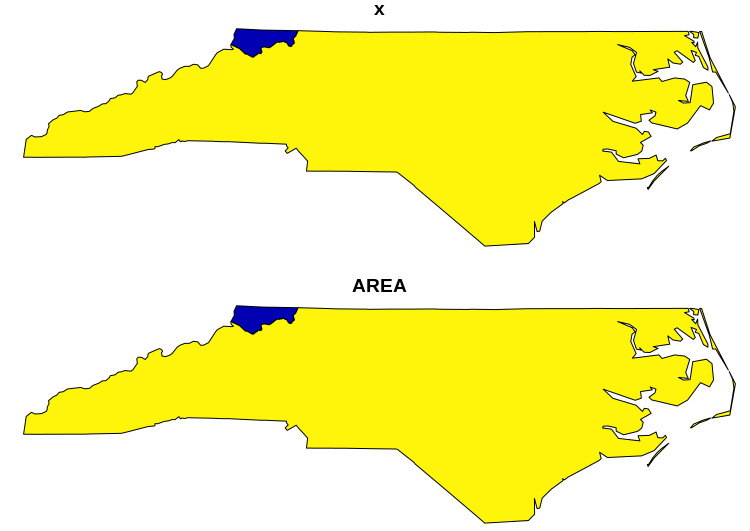
> plot(nc2)

enter image description here

2

Perhaps sf has moved on a bit since 2019, but I think there's a more natural way to achieve this now, without a special function. summarise drops a lot of variables, so you need to think about how you want to combine them; here AREA is summed, by way of example.

library(sf)
library(dplyr)
#load nc data
nc <- st_read(system.file("shape/nc.shp", package="sf"))
nc$x <- c(rep(1, 2), rep(2, 98))
nc2 <- nc %>% 
  group_by(x) %>% 
  summarise(geometry = st_union(geometry),
            AREA = sum(AREA))
plot(nc2, max.plot = 1)
1
  • I used geom = st_union(geom) and that worked too
    – Nova
    Commented May 9, 2023 at 15:56

Your Answer

By clicking “Post Your Answer”, you agree to our terms of service and acknowledge you have read our privacy policy.

Not the answer you're looking for? Browse other questions tagged or ask your own question.