3

I am trying to make a thematic layer using the attributes from my now main table which were previously joined.

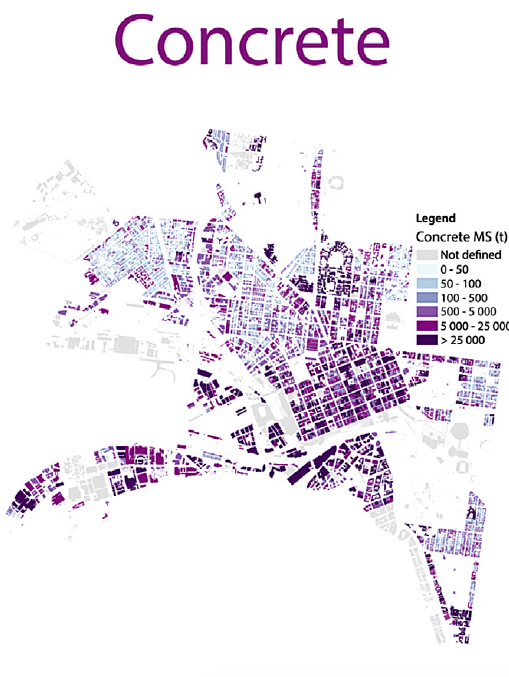
I would like it to look something like this: enter image description here

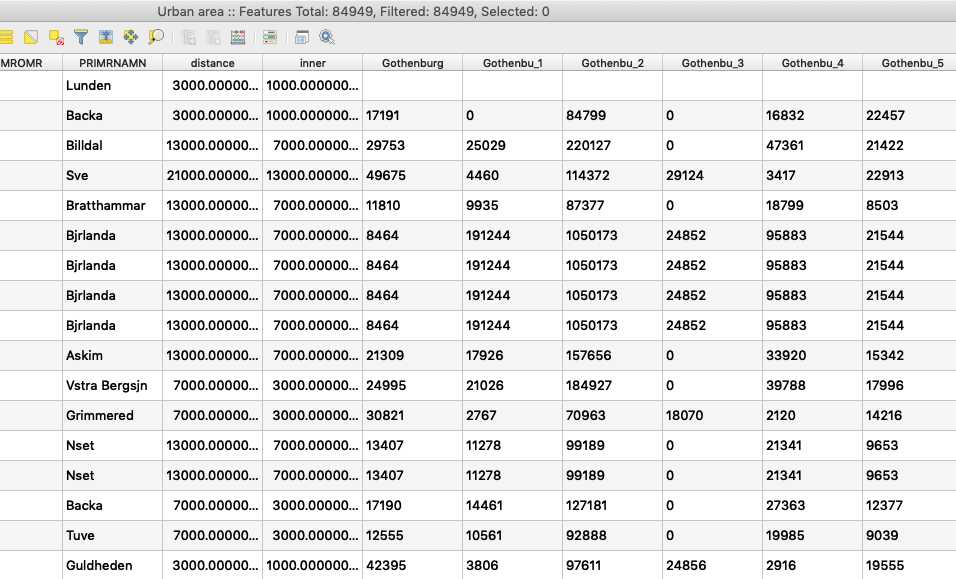
As visible in picture, the columns starting with Gotenburg, Gothenbu_1 etc are in the table joined. enter image description here

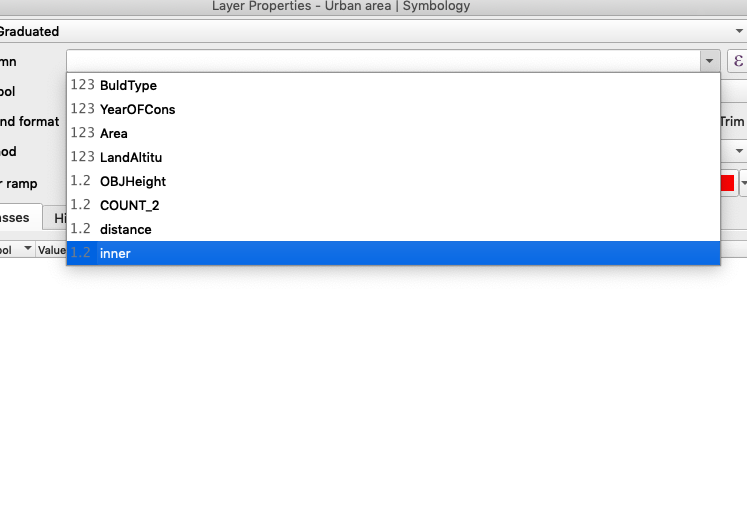
But when I try to create categories based on its values, I do not have the option to use those attributes. As seen in next photo.

enter image description here

2
  • 1
    Can you try Categorised symbology and see if the joined columns show up there? If they do, then the join has worked - maybe the columns in your original table were text data type (despite the data being numeric - this can happen when joining csvs for example). Text columns may not show up under the Graduated symbology drop down list (which typically only shows numeric types).
    – she_weeds
    Commented May 5, 2019 at 0:37
  • Hi @she_weeds. Yes, they show in Categorised symbology. And the joined columns are described as string in info. So how can I then use the Graduated? There is a high entry of values in this tables, and I would like to have some categories from 0 to highest. I tried How to change the type of a column of an attribute table in QGIS? but the refactored layer still has values as string.
    – Julija M
    Commented May 5, 2019 at 7:11

2 Answers 2

5

To apply Graduated Symbology to numeric values with a text/string datatype, you can perform an in-place conversion using the to_int() (for integers) or to_real() (for decimal values) function in the expression builder.

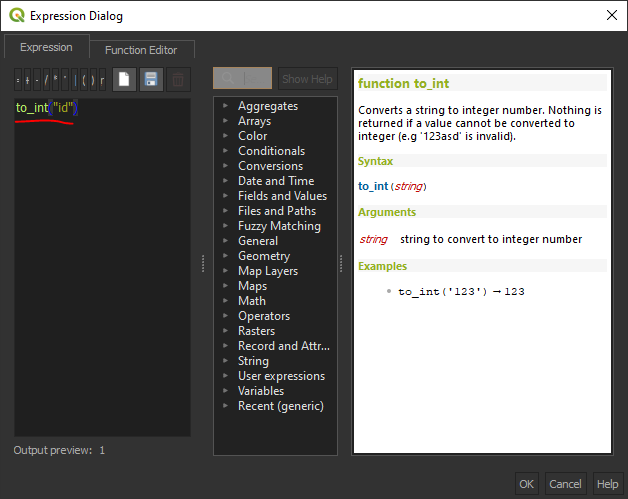
Next to the drop-down box for selecting columns there is a little ε symbol. Click on that to open the Expression builder and use one of the above functions like so: to_int("Gothenburg")


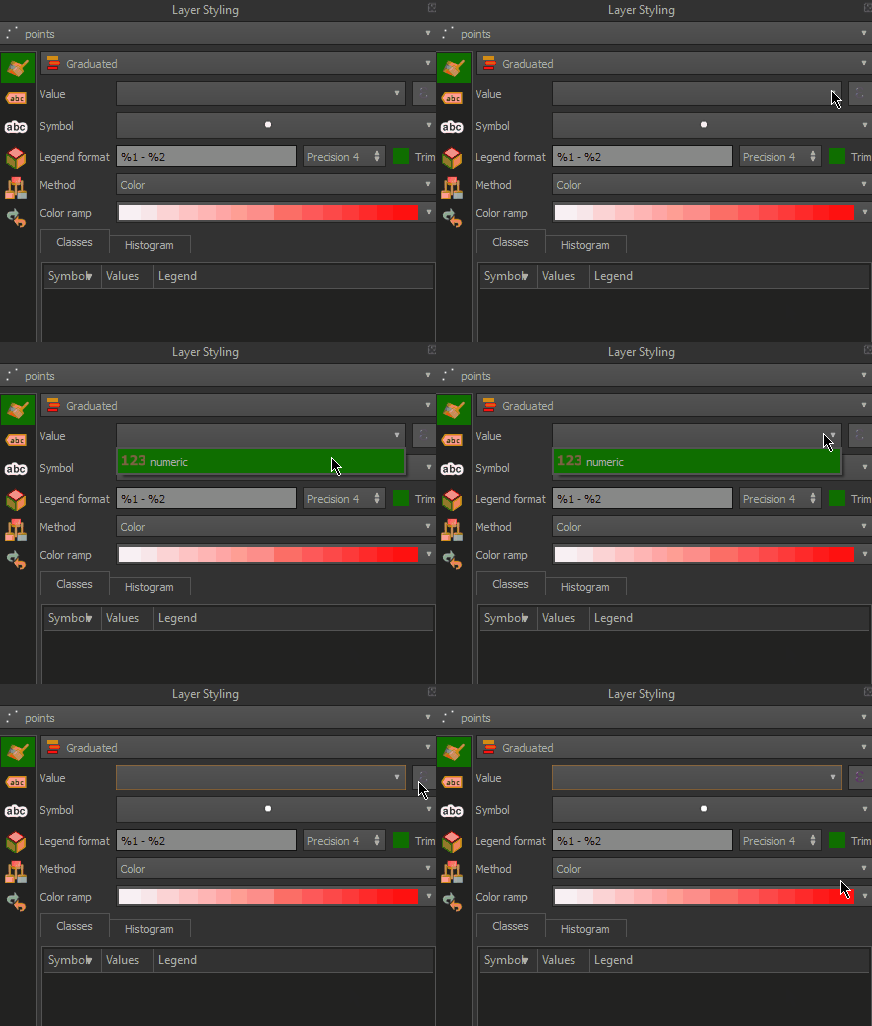
In this example below showing the Graduated symbology window I have a points layer where "id" is a text field. But it does not appear in the dropdown list - only a numeric field called "numeric", so I have clicked on the symbol next to the list.
enter image description here

This opens up the Expression builder where you write your expression.
enter image description here

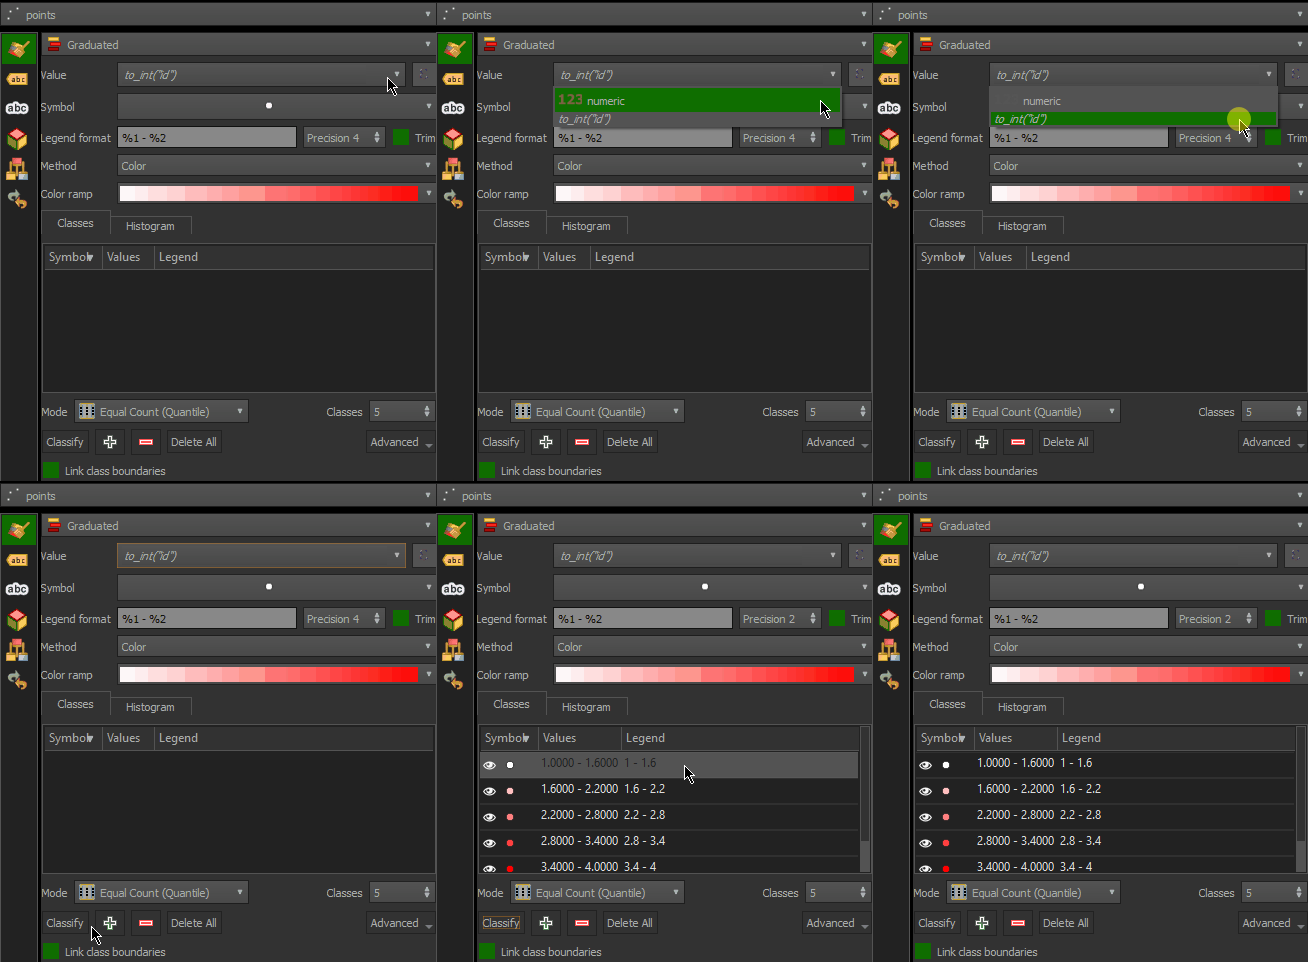
Now you will see the expression in the drop-down list. Click Classify and you will be able to categorise accordingly (this works even if you have NULL values, or values that could not be converted to an integer, however they won't show up on your canvas at all).
enter image description here

Note, you shouldn't ever be able to see the actual field in the drop down box ("id" in this case). It is just an expression and it's temporary - note it's italicised. If you use the Expression editor to create an expression out of a different field, that original expression will be lost.


Note however this can be memory intensive depending on the size of your dataset as it is (a) joining data and (b) converting its type. If you want to permanently change the datatype to numeric but retain the join, you need to change the way the source data is read in QGIS. If your source data is a CSV try adding it to your project using Add Delimited Text Layer (which should auto detect datatypes - although mainly from the first row, so if your first row is NULL it may interpret it as string), rather than dragging and dropping (which will always interpret all columns as text/string)
4
  • So this did not work unfortunately. The thing is I have one joined layer, made by drag and drop. Because adding the delimited text layer did not separate columns, all the attributes were in one merged. When I wanted to do suggested on that layer, it does not even offer me the joined columns in that small drop down box. Then I checked in properties, and they are there. So I am confused.
    – Julija M
    Commented May 5, 2019 at 17:00
  • Second from this layer I have made another one, which was intersected with buffers, and that one contained all the joined attributes (I just do not remember if I have made a join again), and they are visible in drop down box, to_int("Gothenburg") was done but still in Graduated I do not see the needed attributes. :(
    – Julija M
    Commented May 5, 2019 at 17:00
  • Did you remember to click Classify after putting in to_int("Gothenburg")? It won't show the symbology until then. As for your first comment I don't exactly understand what you mean but I think you need to try the Add Delimited Layer option again and use the correct delimiter (you can open your CSV with a text editor like Notepad to see what delimiter is used to separate your data - space, comma, tab....)
    – she_weeds
    Commented May 5, 2019 at 21:08
  • I ended up redoing my whole work. I joined the table by Delimited Text. But as I am Mac user, my csv needed to be imported with ''custom delimiters and semicolon''. So it work as you said in the end. Thank you
    – Julija M
    Commented May 6, 2019 at 5:06
1

Something I just spent a while debugging was the difference between using single and double quotes.

 to_real(REPLACE("density" ,',','')) 

worked

 to_real(REPLACE("density" ,",","")) 

did not

1

Your Answer

By clicking “Post Your Answer”, you agree to our terms of service and acknowledge you have read our privacy policy.

Not the answer you're looking for? Browse other questions tagged or ask your own question.