Note: I have a basic idea of how shapefiles work & how to save maps as images.
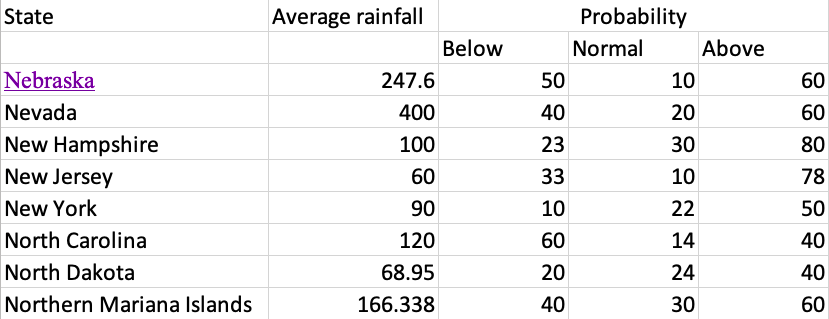
I'm a super noob on QGIS. I have this CSV which provides me details such as
- State
- Average rainfall (mm)
- Probability % - Levels
(Normal,Above,Low)
Sample Data:
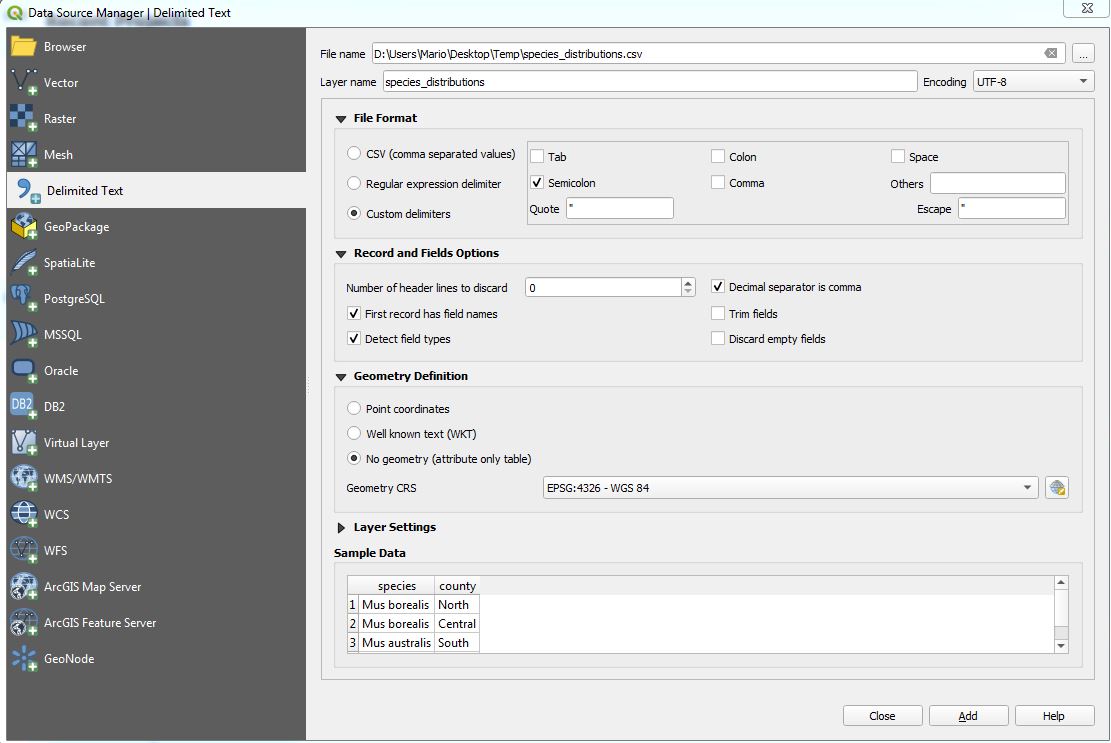
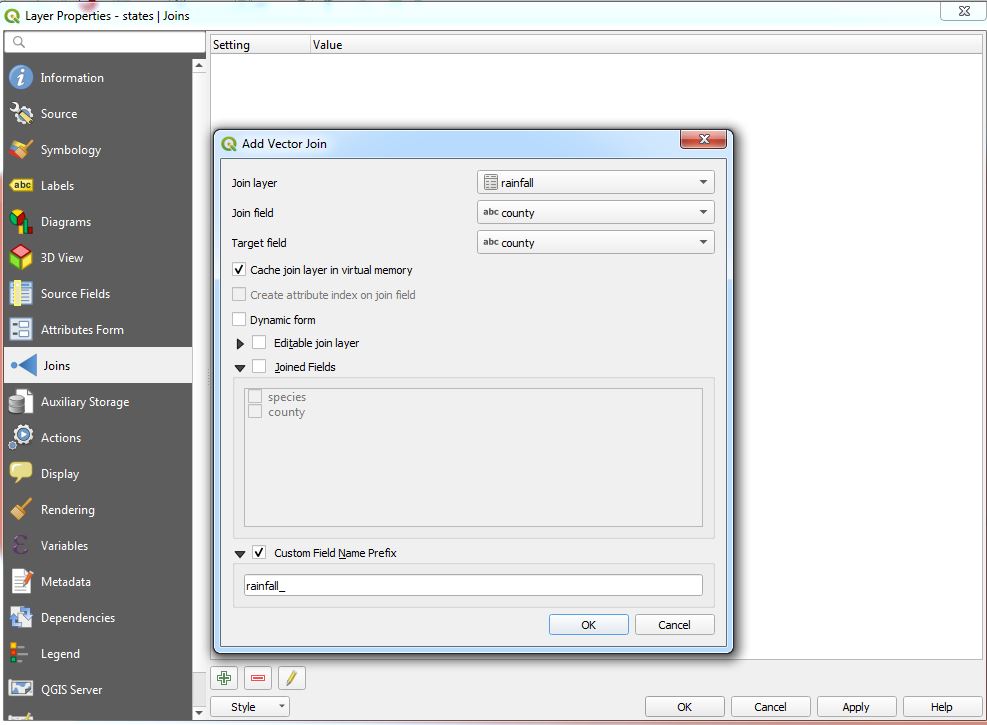
How can I visualise this on a map using QGIS? Please direct me to source on how to use the above dataset on QGIS & how to plot a legend alongside it. (I have the shapefiles of the states)


