3

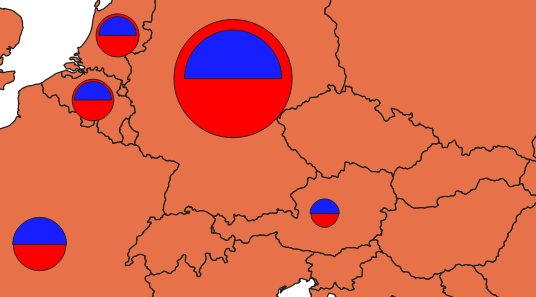
I am new to QGIS and can't figure out how to display a legend for the dot size of a centroid, simple marker. The size of the dot is dependent on a value from a CSV linked to a layer map of Europe. I have two dots per country (different years). This is a snippet of the map:

enter image description here

Now what I need is to be able to display a legend for the size of the dots. It is showing me a legend in the "symbol size" menu: enter image description here
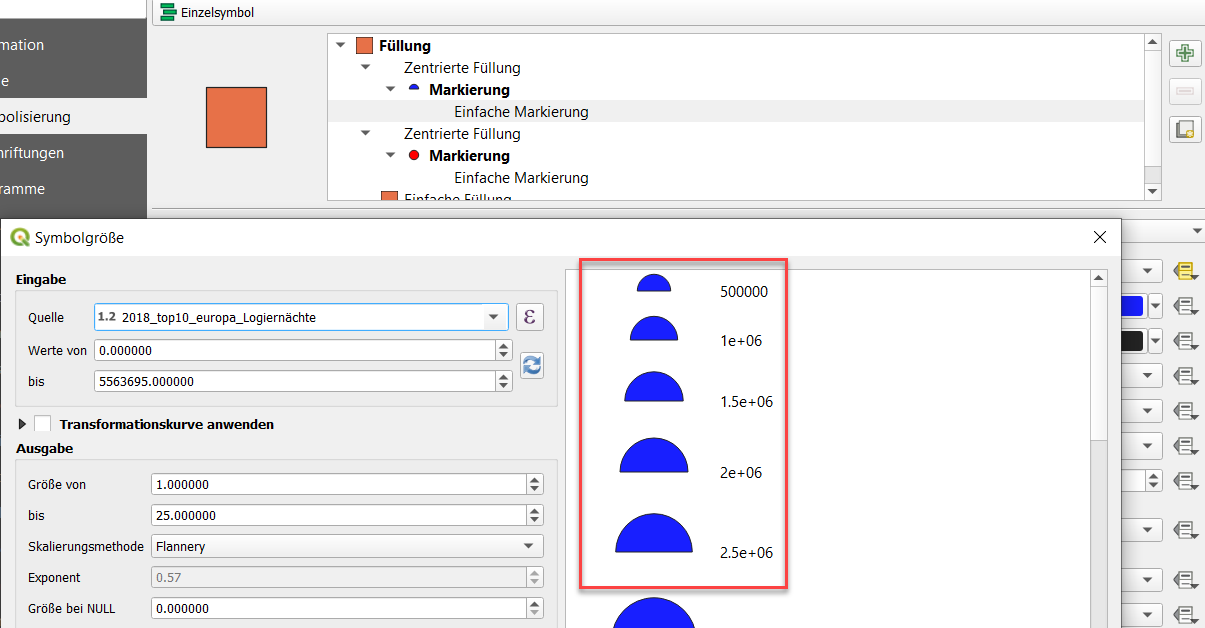
I was able to create a legend while using graduated symbols. I also tried using graduated and then switch method to "size". However, even in a new project, the only option I get is color:

enter image description here

So this is not an option either. I'm using QGIS 3.8.

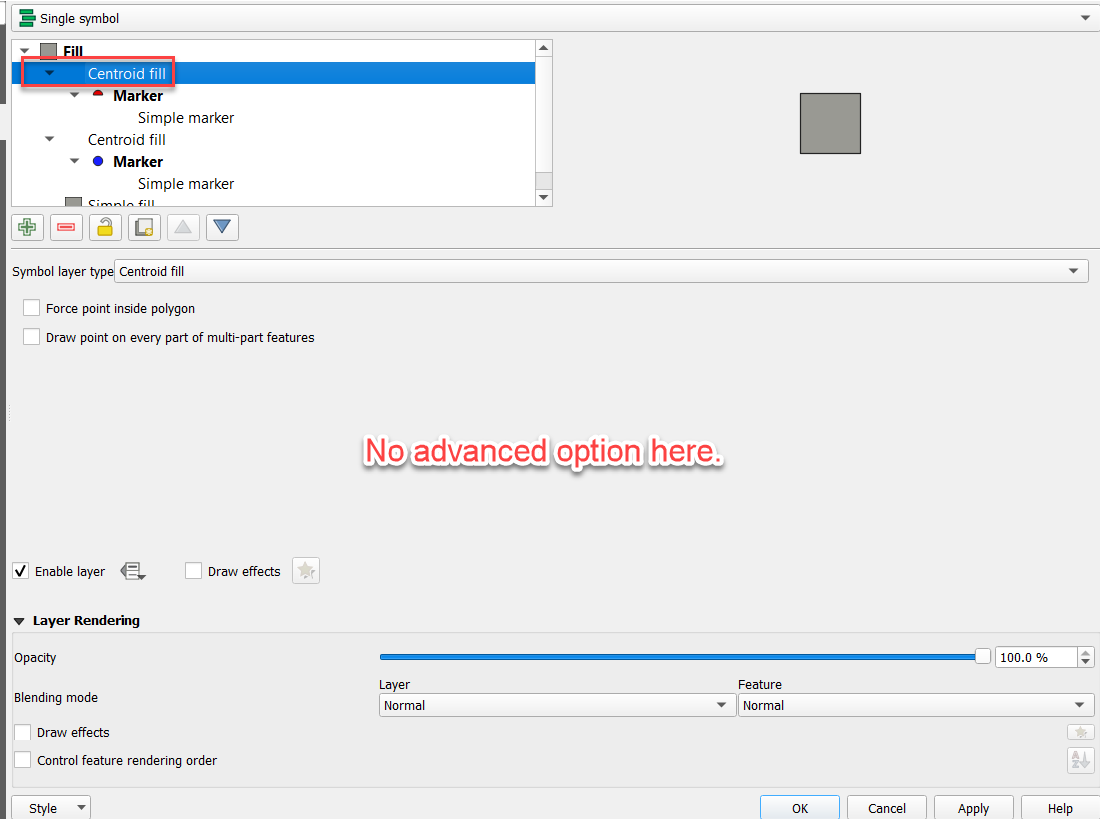
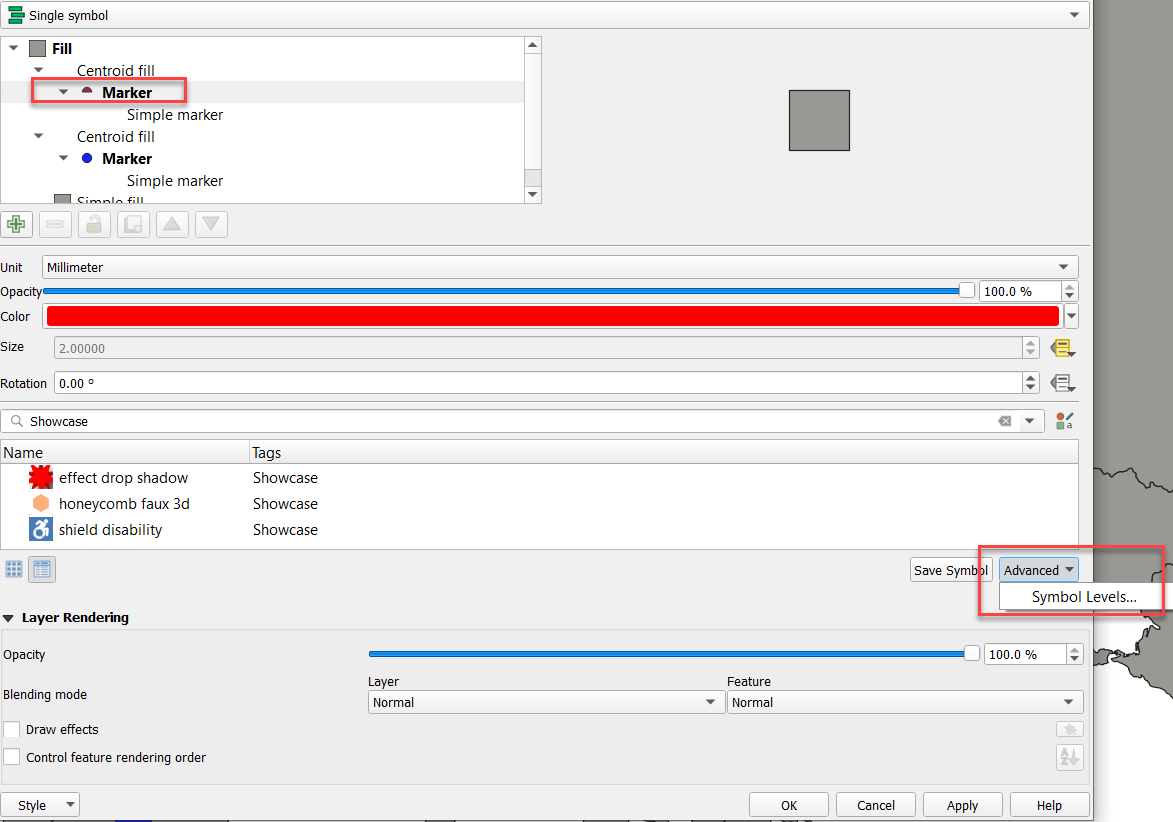
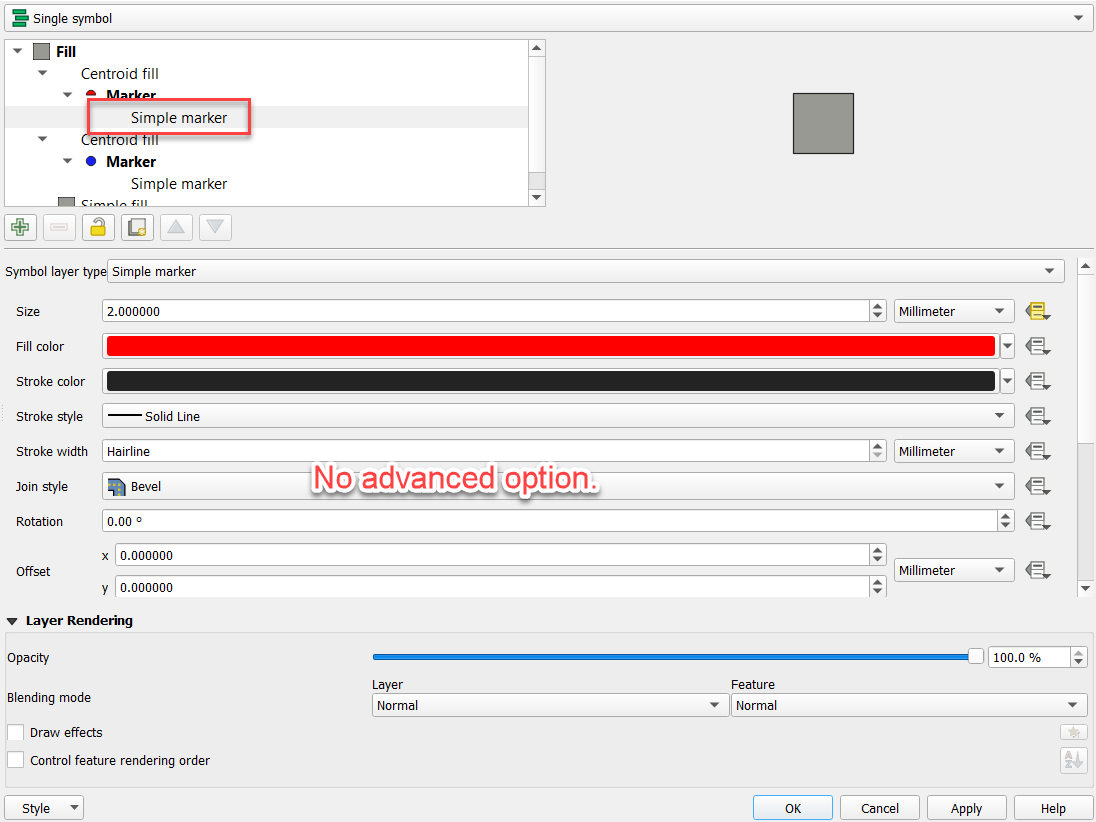
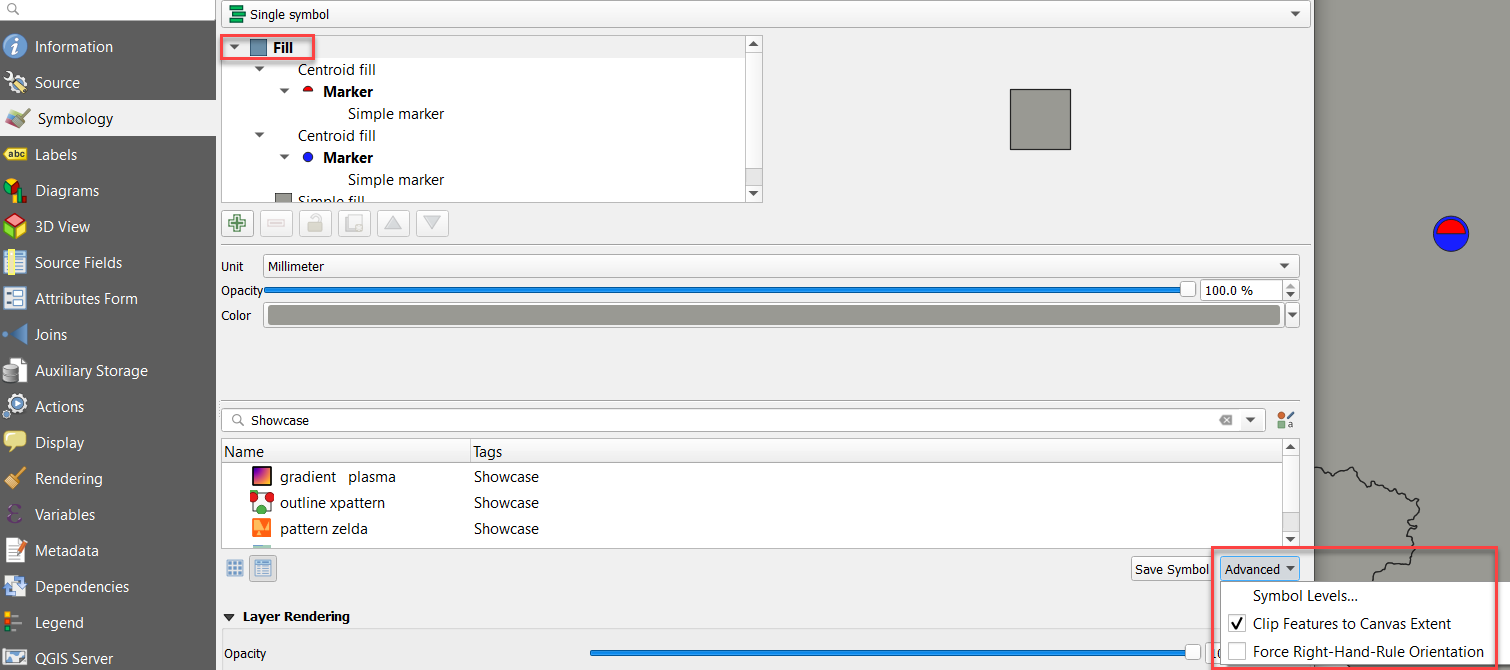
Edit: Conerning Josephs answer: I can't find this optione. I do have the advanced dropdown on certain levels, but not on all of them. Here with Screenshots: First level: enter image description here Second level: enter image description here Third level: enter image description here Fourth level: enter image description here
1

1 Answer 1

1

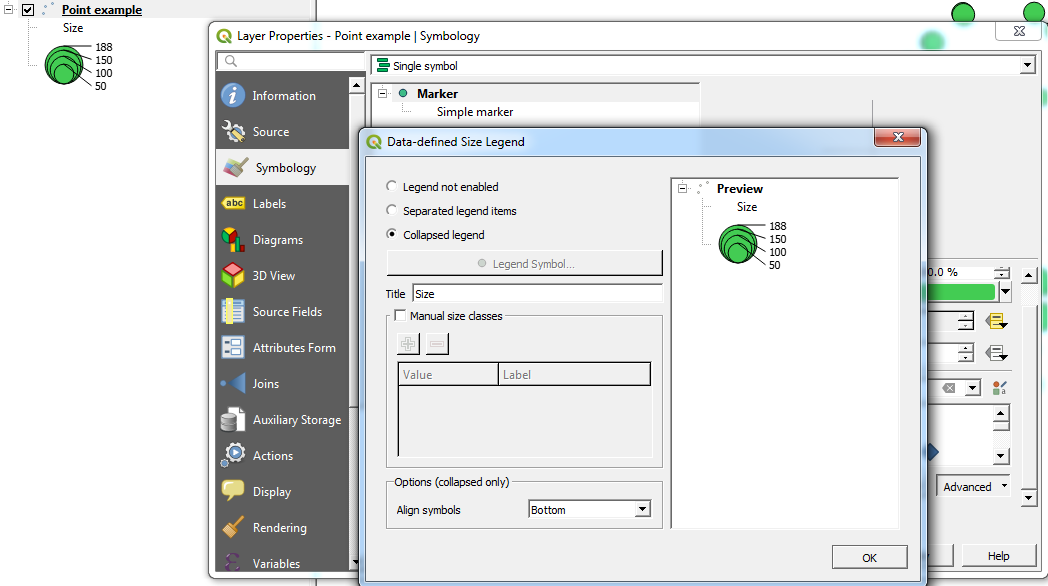
Once you have defined the field for your Size parameter, there is an advanced option where you could set the data-defined size legend if you click on the top main marker. Here you can set the size legend manually or use the values automatically from the field you specified:

Data-defined size legend

4
  • Hey Jospeh, Thanks for your help! However, I can't find this option. I did edit the first post and add some screenshots. It also seems that I have three levels for the marker and you only two (Marker -> Simple marker). For me it is centroid Fill -> Marker -> Simple Marker. Might this be the reason why I can't find the option? Thanks & best, Stefan
    – stibi
    Commented Jul 2, 2019 at 19:20
  • @Stefan - Apologies, when you mentioned using a csv I assumed you were using a point shapefile which is where this option is available. I don't think it's possible using it for a line/polygon shapefile. An alternative could be to create a new point layer which uses data from the csv or polygon layer and then add the size legend.
    – Joseph
    Commented Jul 4, 2019 at 10:11
  • Hey Jospeh, no need to apologize - you're trying to help :) I figured that ou myself by now. My idea was using the vector polygons tools -> Polygon centroids. This way I get a point layer. The only problem: with the linked csv I was able to uncheck "Draw point on part of every multi-part features". I can't do that now and this means that there X points per country. Any input here? I also can't filter the attibute tables becaus it does not include any coordinates.
    – stibi
    Commented Jul 4, 2019 at 18:27
  • @Stefan - You could run the Dissolve tool and select the country field. This merges all features which have the same country value.
    – Joseph
    Commented Jul 5, 2019 at 9:16

Your Answer

By clicking “Post Your Answer”, you agree to our terms of service and acknowledge you have read our privacy policy.

Not the answer you're looking for? Browse other questions tagged or ask your own question.