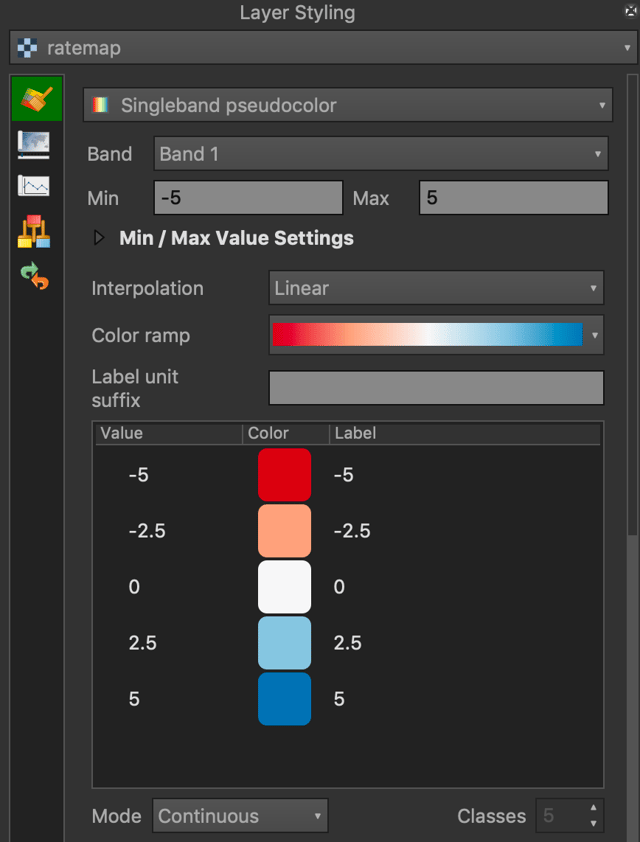
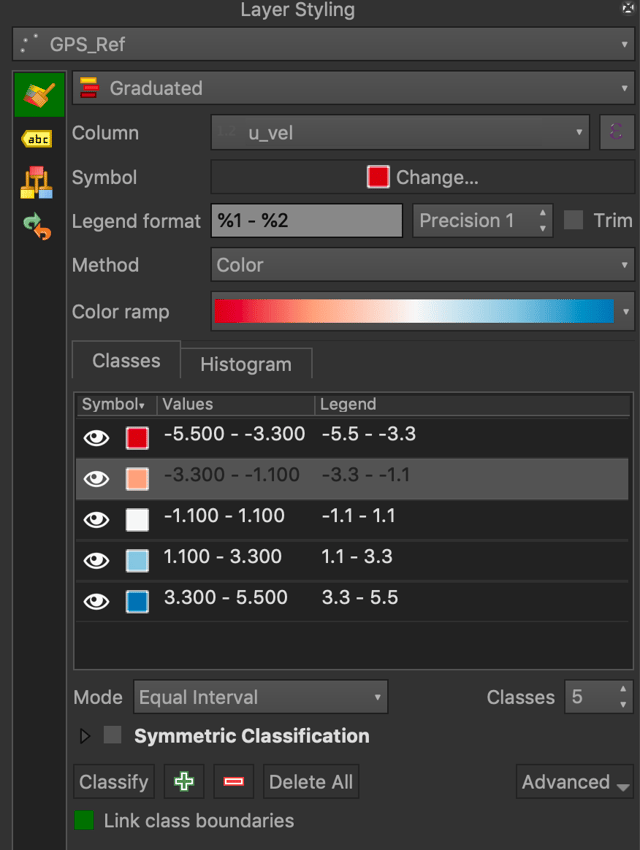
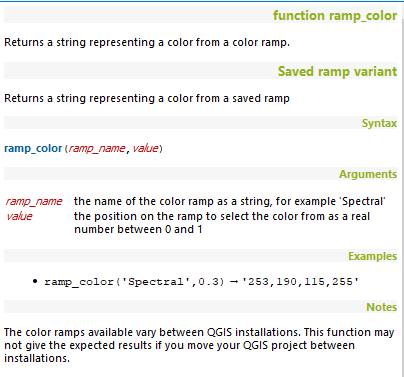
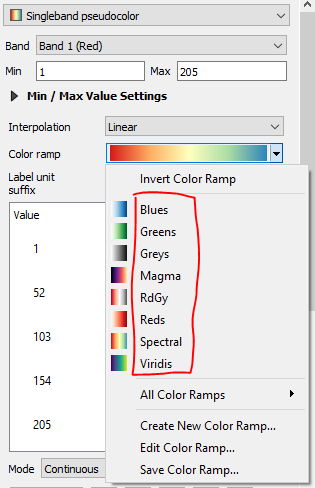
While it's simple to color a point shapefile by an attribute field, I can't figure out how to match the colors with those from a raster.
I have a raster file that I'm displaying with a continuous colormap, with values clipped between -5 and 5. Using 5 colors results in colors -5, 2.5 0, 2.5 and 5. I'm forced to use the singleband_pseudocolor symbology so that I can clip the values.
The values in my point shapefile are all negative, between -0.5 and -2.3. I want to match the colors to the 5 colors in the colormap, but the colormaps will only reflect the values in the point shapefile.
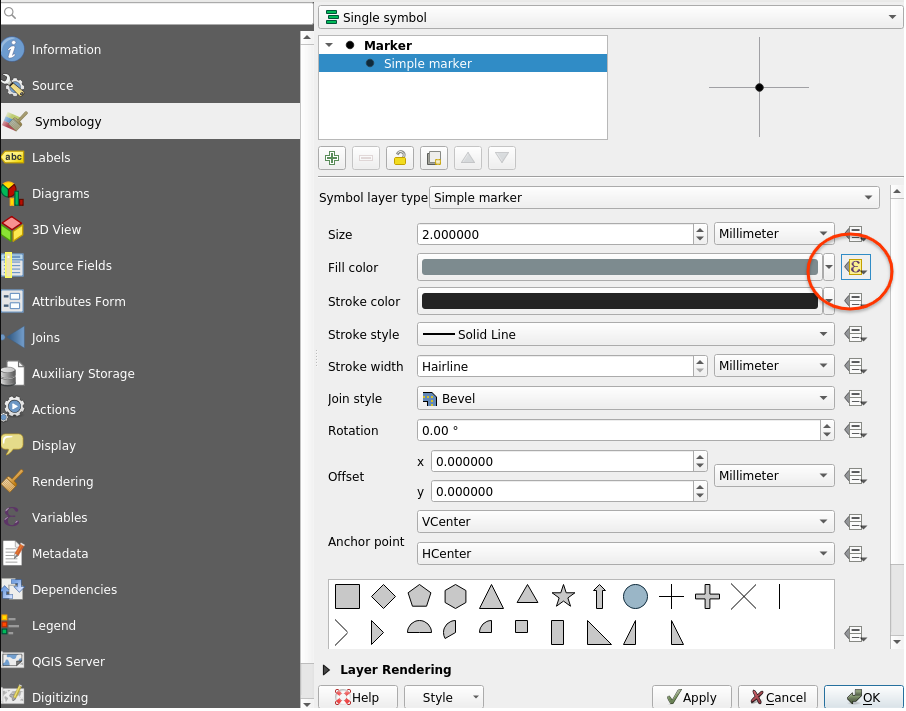
I've tried saving/applying the colormap of the raster file, and manually adding extra points to match my limits; the former does nothing and the latter causes the endpoints to mismatch so there is one less color than there should be. I've also tried to rasterize the points but this isn't working at all.
I'm doing this in QGIS and can attach screen shots if necessary.

