26

From wikipedia page:

Change detection for GIS (geographical information systems) is a process that measures how the attributes of a particular area have changed between two or more time periods. Change detection often involves comparing aerial photographs or satellite imagery of the area taken at different times. The process is most frequently associated with environmental monitoring, natural resource management, or measuring urban development

How is the comparison done? With what tools?

I feel that the description is not complete. Or something is missing.

Where or in which books can I find more information about Change Detection?

What tools should I use to perform such an analysis using the data in a shapefile? (only open-source please)


Some papers on change detection (theory and techniques)

Change detection techniques (D. LU, E. BRONDI, ZIO and E. MORAN, 2004, pdf)

Trend change detection in NDVI time series: Effects of inter-annual variability and methodology Forkel, M. , Carvalhais, N. , Verbesselt, J. , Mahecha, M.D. , Neigh, C. , Reichstein, M. (2013) Remote Sensing 5 (2013)5. - ISSN 2072-4292 - p. 2113 - 2144.

Shifts in global vegetation activity trends Jong, R. de , Verbesselt, J. , Zeileis, A. , Schaepman, M.E. (2013) Remote Sensing 5 (2013)3. - ISSN 2072-4292 - p. 1117 - 1133.

Relationships between declining summer sea ice, increasing temperatures and changing vegetation in the Siberian Arctic tundra from MODIS time series (2000–11) Dutrieux, L.P. , Bartholomeus, H.M. , Herold, M. , Verbesselt, J. (2012) Environmental Research Letters 7 (2012)4. - ISSN 1748-9326 - p. 12.

Near real-time disturbance detection using satellite image time series Verbesselt, J.P. , Zeileis, A. , Herold, M. (2012) Remote Sensing of Environment 123 (2012). - ISSN 0034-4257 - p. 98 - 108. Trend changes in global greening and browning: Contribution of short-term trends to longer-term change Jong, R. de , Verbesselt, J. , Schaepman, M.E. , Bruin, S. de (2012) Global Change Biology 18 (2012)2. - ISSN 1354-1013 - p. 642 - 655.

Phenological change detection while accounting for abrupt and gradual trends in satellite image time series Verbesselt, J. , Hyndman, R. , Zeileis, A. , Culvenor, D. (2010) Remote Sensing of Environment 114 (2010)12. - ISSN 0034-4257 - p. 2970 - 2980.

Detecting trend and seasonal changes in satellite image time series Verbesselt, J. , Hyndman, R. , Newnham, G. , Culvenor, D. (2010) Remote Sensing of Environment 114 (2010)1. - ISSN 0034-4257 - p. 106 - 115.

(I'll add more in the future as If I discover more notable papers)

2
  • 2
    Four aspects of change detection, particularly important when monitoring natural resources (Macleod and Congalton 1998): Detect changes, Identify nature of change, Measure change extent, Assess spatial pattern of change. Commented May 2, 2013 at 21:49
  • Allow me to add a time series-based analysis method for fuzzy detection of change (i.e., rather than telling there is a change or not, it tells the probability of the change occurance): github.com/zhaokg/Rbeast.
    – zhaokg
    Commented Oct 23, 2023 at 15:00

6 Answers 6

16

Change detection is a common operation/module in remote sensing packages like ENVI or Orfeo toolbox. It usually involves raster data (satellite images for example).

How is the comparison done? With what tools? I feel that the description is not complete. Or something is missing.

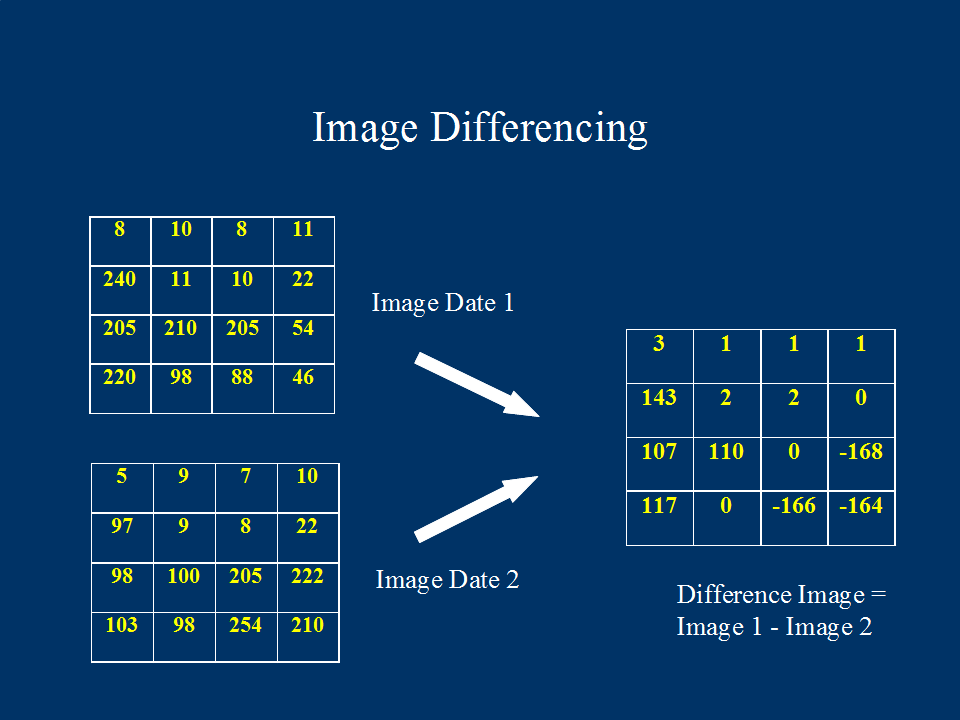
Change detection is done by comparing two raster images that were taken at different times but which cover the same area. As the images cover the same area, the images overlay each other. Imagine two grids stacked on top of each other.

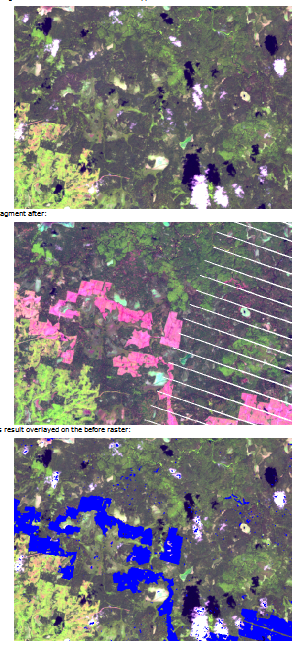
It is then a matter of comparing whether the value of a pixel in the new raster is the same as the value of the pixel in the old raster. Pixels that have changed are then marked. The output is usually a raster that covers the same extents as the two images with the changed areas highlighted. It's a simplification of course but you get the idea :)

enter image description here

Where or in which books can I find more information about Change Detection?

You can start with these documents

What tools should I use to perform such an analysis using the data in a shapefile? (only open-source please)

You can try out Opticks. It has a change detection plugin.

14

Check out DTclassifier here which you can use with QGIS.

DTclassifier provides simple streamlined interface for raster classification and change detection using decision trees.

Plugin features:

  • integrated approach — perform all operations including training data collection, tree-building and classification in QGIS
  • first example of using computer vision library OpenCV in QGIS
  • use of non-parametric classification algorithm — decision trees.

You can find a tutorial here.

Beside this you can glance at this post here, Entropy change detection

change detection

1
  • yes the visual examples were very informative. Thank you!
    – nickves
    Commented Sep 13, 2012 at 13:57
9

I don't think you will find many tools for change detection on vector data (like shapefiles) because its a trivial problem - just walk the points, and tell me if they are the same.

Change detection is more typical for raster images (e.g. SAR images, or visual/IR images), where the problem is detecting what has changed from one satellite pass to the next, or from one aircraft overflight to the next, or "before and after" on a site that has experienced natural disaster.

For raster images, one open source toolkit option is Orfeo Toolbox.

3
  • Yes, I agree about the triviality on vector data. I updated my question to include raster as well
    – nickves
    Commented Sep 13, 2012 at 10:07
  • 5
    The problem with vector data sounds trivial only because you pose a trivial question! E.g., when the shapes are polygons representing extents of things on the surface, such as forest cover, urban development, etc., then change detection requires intersecting the layers and analyzing the geometry of the overlaps. When the shapes are linear, one is usually interested in measuring how different the shapes are--how far apart on average, at most, etc., When the shapes are points, one wants to measure typical distances between points, whether new points have appeared, and old ones disappeared.
    – whuber
    Commented Sep 13, 2012 at 16:55
  • I don't have a full answer for this, but I still think it may be an easier problem (trivial only in the simplest case) since you already have "good" data, and don't need to deal with the registration / classification part first. I'm not aware of anything that tries to deal with unclassified feature data, but there are metrics in most GEOS-based software for things like simple distance calcs, Hausdorff distance and so on.
    – BradHards
    Commented Sep 14, 2012 at 9:28
2

Change detection

Change detection, in the Remote Sensing discipline, is the analytical process that aims to detect changes -- over time and space -- of the land cover or/and land use.

PCA as a change detection technique

Among the most common and successful change detection practices, is the application of Principal Components Analysis (PCA) on bi- or multi-temporal multi-dimensional data (Lu et al., 2003).

What is PCA?

Principal Components Analysis (PCA) is a multi-dimensional linear transformation algorithm. It reconstructs a multivariate data set in a way that the first variables, called principal components (PCs), contain most of the original data variance. Thus, PCA provides the potential to describe or represent reliably a multi-dimensional data set by using fewer dimensions than the ones that compose the initial data set (Jolliffe, 2002).

How does it work?

PCA redirects the highest variances of the original data set, which mainly resemble unchanged landscape characteristics, in the first components. It is the user's responsibility to then extract changes by means of advanced digital image processing operations, i.e. image (segmentation and) classification.

PCA-based change detection using (G)FOSS

PCA is implemented in GRASS-GIS (i.pca module), R (princomp() and prcomp() functions), OrfeoToolbox, SAGA-GIS and probably more (Free &) Open Source Applications.

An example in-depth work, from which most of the above text has been extracted, demonstrates how to map burned areas -- which is essentially a change detection analysis -- based on PCA and GFOSS. Please, refer to this work for an extensive list of references upon the subject.

On the use of GRASS-GIS and R to perform PCA, there is a dedicated GRASS-wiki page titled Principal Components Analysis.

References

Jolliffe, I. T. (2002). Principal Component Analysis. Springer, 2nd edition. 28 illustrations.

Lu, D., Mausel, P., Brondizio, E., and Moran, E. (2003). Change detection techniques. International Journal of Remote Sensing, 25(12):2365.

2

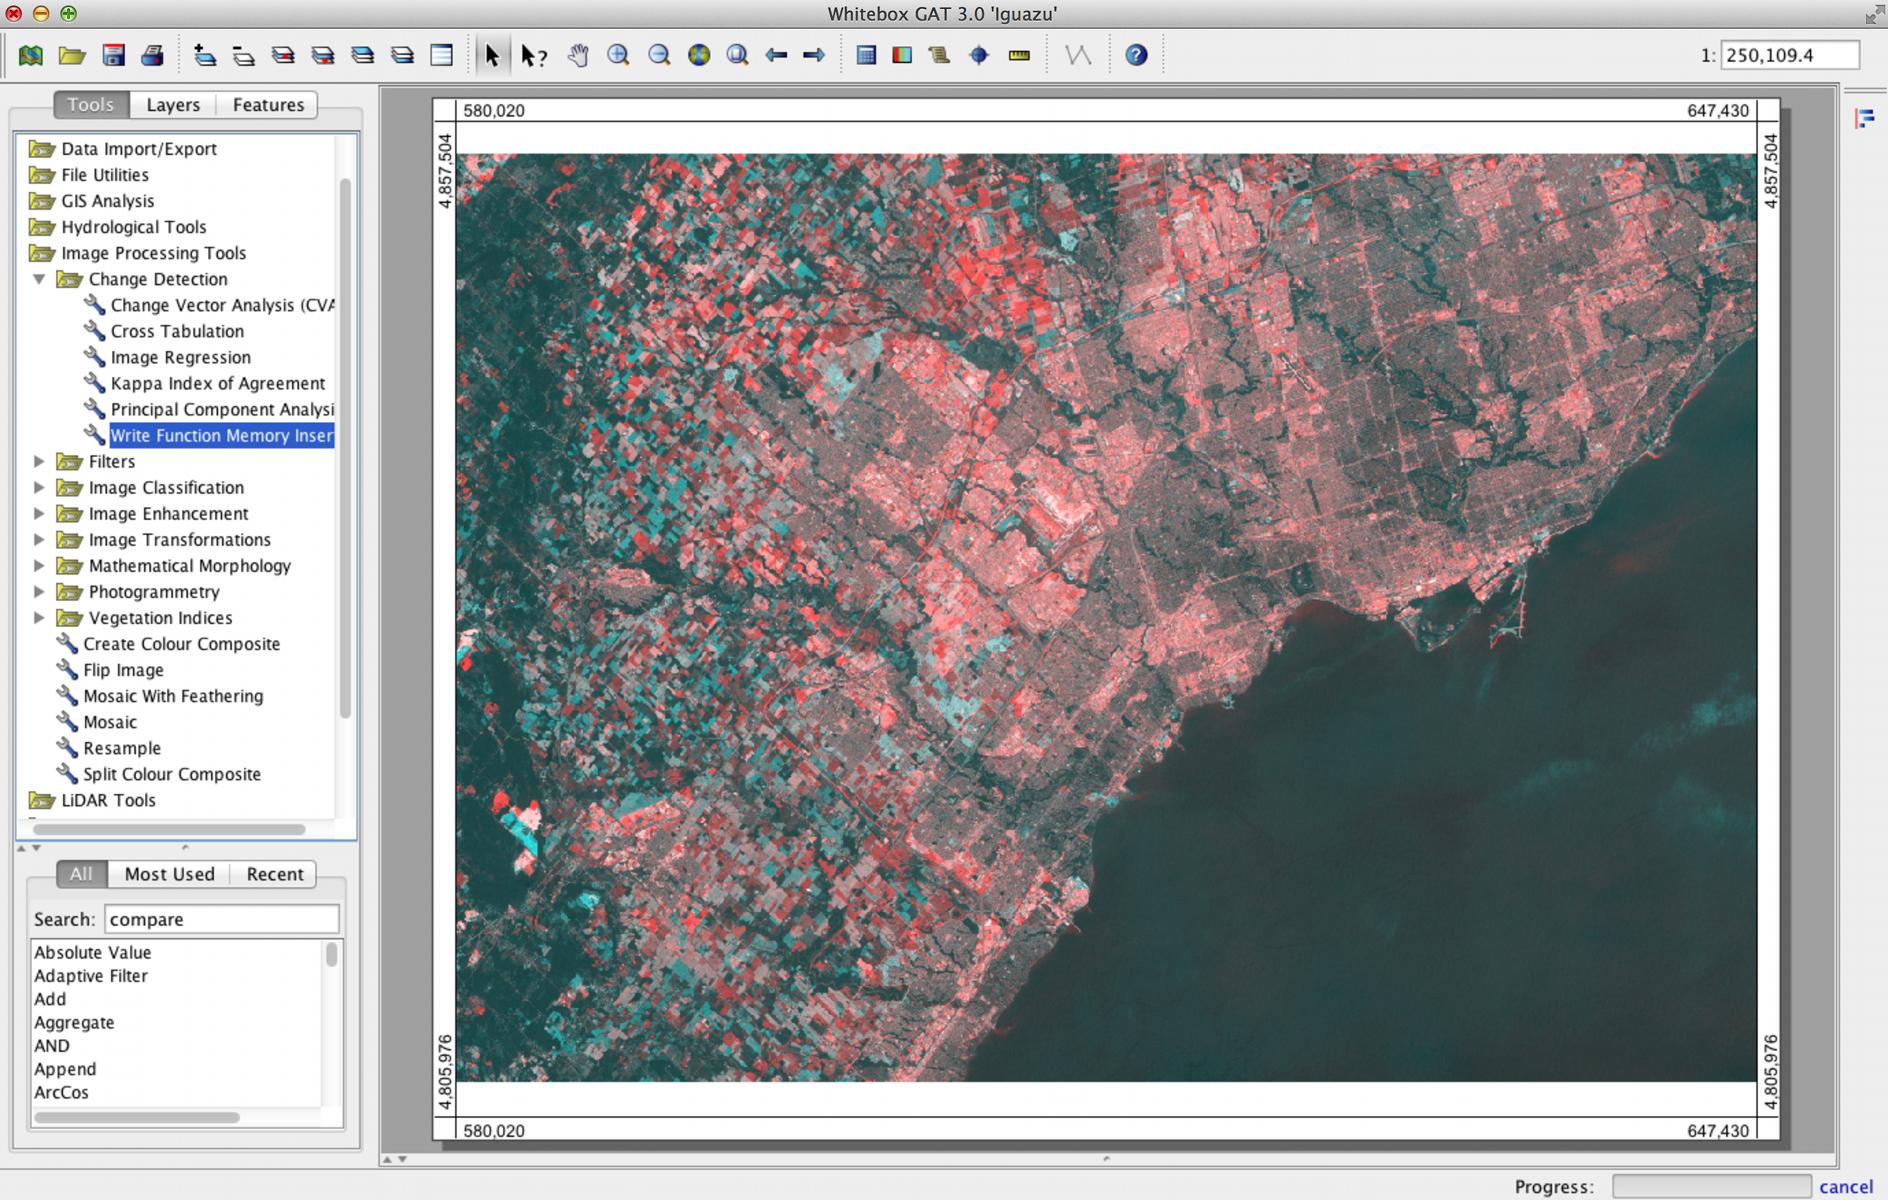
The open source GIS and remote sensing package Whitebox Geospatial Analysis Tools (http://www.uoguelph.ca/~hydrogeo/Whitebox/) has a fairly extensive number of tools for performing change detection on imagery. This includes tools for Change Vector Analysis, Cross Tabulation, Image Regression, Principal Component Analysis, and the Write Function Memory Insertion operation. I'm probably biased, being the lead developer of the software, but I often teach change detection to undergraduate students using Whitebox and my experience has been that it is a user friendly and intuitive software for this type of analysis.

enter image description here

-3

Change detection is much intense study when u are working for urban development, landscape management or forest fragmentation...For such purposes which required a much accurate result, you should first go for classification of an area from past to present and then work with those vector data for change detection study

Your Answer

By clicking “Post Your Answer”, you agree to our terms of service and acknowledge you have read our privacy policy.

Not the answer you're looking for? Browse other questions tagged or ask your own question.