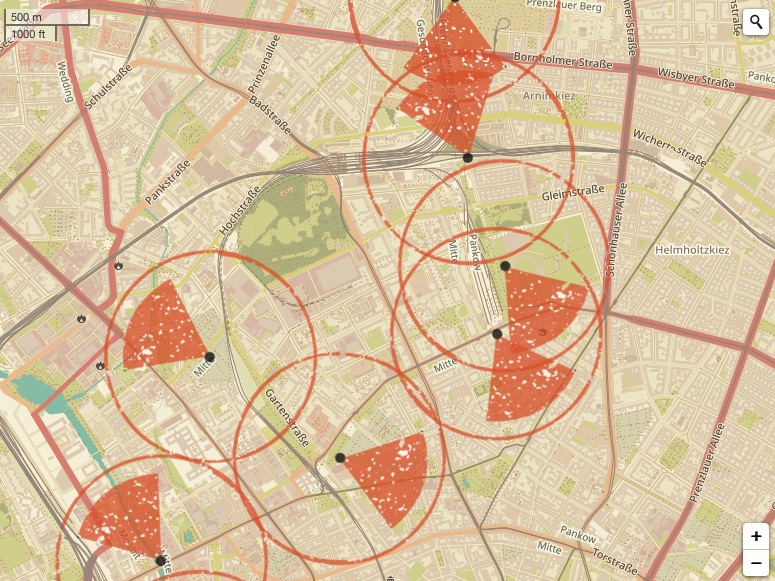
I have a map with 20 markers on a geojson layer. They are all from the same SVG and represent a certain area on the map (meaning they represent a circle of constant radius in meter on the map). I need these marker to adapt their size according to zoom level.
I've tried to use a circle as a marker. But my marker needs to be a SVG because it is complex graphic and radius doesn't apply to markers.
I think each time zoom level changes marker size should be resized proportionally to the new zoom level but I don't know how to achieve this.
He's how the markers are displayed, parsed from a csv sheet :
    for (i in chapters) {
        var c = chapters[i];
        if (!isNaN(parseFloat(c['Latitude'])) && !isNaN(parseFloat(c['Longitude']))) {
            var lat = parseFloat(c['Latitude']);
            var lon = parseFloat(c['Longitude']);
            var cercleDirection = parseFloat(c['Direction']);
            var photoIcon = L.icon({
                                iconUrl: 'media/Cercle.svg',
                                iconSize: [220, 220],
                                iconAnchor: [110, 110],
                            });
            markers.push(
                L.marker([lat, lon], {
                    icon: photoIcon,
                    rotationAngle: cercleDirection

                }));
        } else {
            markers.push(null);
        }
Another way maybe
I did find this approach online that seems interesting. But I couldn't have more explanation from the author that remains silent :
var layer = ''; // what would be the layer name in my case ?
map.on('zoomend', function() {
    var currentZoom = map.getZoom();

    //Update X and Y based on zoom level
    var x= 50/currentZoom; //Update x
    var y= 50/currentZoom; //Update Y
    var LeafIcon = L.Icon.extend({
        options: {
            iconSize:     [x, y] // Change icon size according to zoom level
        }
    });
    layer.setIcon(LeafIcon);
});


L.svgOverlaylayer. I played with it a bit and it works OK, but I just didn't have time to try/implement rotate. I'll be away for a few days. If nobody comes up with the solution till then, I'll continue.