0

I'm using ArcMap 10.7.1 on Windows 10 to symbolize some rasters. Looking at the the unique values, I found duplicates and even triplicates using the Symbology window (see picture).Screenshot of selected duplicate and triplicate values
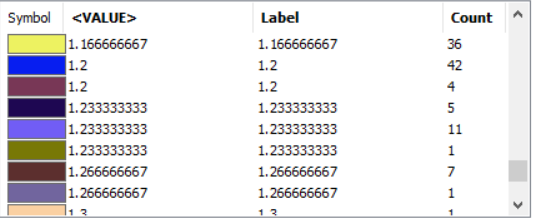
There are about 20 of these cases. I know I could combine the unique values manually by grouping, but I have 100 of these layers to process, so I would like to correct the problem so they don't happen in the first place. The fact that so many duplicates and triplicates exist makes me wonder what's going on behind the scenes and if there's something strange with my data or the way the raster is formatted.

1 Answer 1

1

It appears that you are trying to display a continuous variable using discrete values. You may want to either display the features as a scaled gradient according to the magnitude of your value column, or possibly just reduce the number of classes in your classification to match the number of unique values that you have in your dataset.

If the field is numeric, try clicking the remove all fields button, then clicking the add all fields button to see if the fields will be consolidated.

7
  • It is my intention to do that eventually, but I am also interested in inspecting the unique values as a sensibility check. I am wondering what is causing there to be duplicate and triplicate unique values.
    – Mon Mo
    Commented Sep 25, 2019 at 22:01
  • Can you open the attribute table and right click the heading for your Value column then go to properties, then confirm what type of field the column is?
    – Kartograaf
    Commented Sep 25, 2019 at 22:24
  • It's a 64 bit double precision raster with decimal values. It does not have an attribute table.
    – Mon Mo
    Commented Sep 26, 2019 at 0:06
  • Due to the bit depth, there are a huge range of possible values for each cell in your raster (2^64). What do the values in your pixels represent? I'm trying to understand why you want to display the image with unique symbology for each value because, depending on the dimensions of your image, this may not be feasible.
    – Kartograaf
    Commented Sep 26, 2019 at 0:41
  • These values are a sum of several different raster layers representing an index of vegetation presence at different times - the higher values, the more likely that vegetation will be present. For my end reports, I am using a different symbology method, but right now I am interested in how many unique values of the index are >1. I'm trying to use symbology to see how many and where they are.
    – Mon Mo
    Commented Sep 26, 2019 at 19:48

Your Answer

By clicking “Post Your Answer”, you agree to our terms of service and acknowledge you have read our privacy policy.

Not the answer you're looking for? Browse other questions tagged or ask your own question.