2

I have been playing around with a variety of map projections for the purposes of transforming between various representations.

The thing that I still don't quite understand is how to interpret the (x,y) values of the projection. Take the Mercator projection, for example. I get that (x,y) represent locations on the tangent plane, except that they are still in spherical coordinates: e.g. x = lambda - lambda_0.

How do these (x,y) values translate to actual locations on the tangent plane (i.e. the map) if they're still in spherical coordinates? In my case, I ultimately need to identify actual pixel locations when I render the new projections, but generally speaking it is not clear to me what these spherical (x,y) values mean with regard to the mapping surface.

-----Update-----

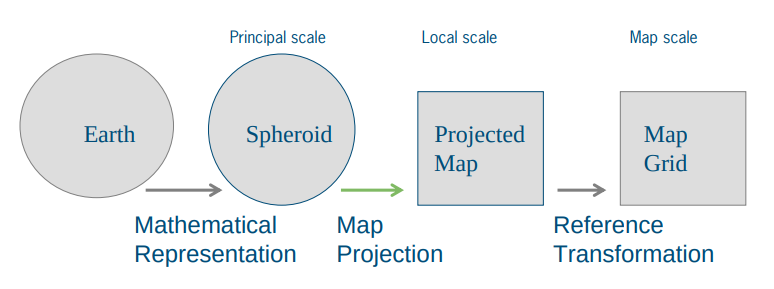
Perhaps this additional info may help to explain my confusion. I found the image below on slide 60 of this powerpoint. I think it illustrates the step I am confused about. Here it's called the reference transformation. I've been reading through Snyder's "Map Projections: A Working Manual" and I think I've concluded that the rectangular coordinates output from the forward projections are arbitrary in scale. Where I am struggling is how to go from that arbitrary scale to my pixel grid.

enter image description here

-----Update 2-----

I hope it may be more clear if I explain how I have arrived at my confusion.

When resampling an image according to some function (e.g. "undistorting" an image, which is kind of like an inverse projection of some image distortion), the standard algorithm is:

(1) Apply the inverse projection to the normalized pixel coordinates of the image

(2) Find the min/max bounds of that projection and create a grid in that space

(3) Apply the forward projection to the normalized coordinates of that grid to determine where in the original image to sample

(4) Sample according to the output of step (3) in order to render the new image.

I have been trying to follow these steps for converting between an equirectangular map and various projections. It seems my mistake is that, in the algorithm I laid out above, the projected space is always a pixel coordinate system.

Am I correct to understand that each map projection has its own rectangular coordinate system? That is, Mercator rectangular coordinates mean something different than Gnomonic rectangular coordinates, etc. If so, is it based on the class of projection (planar, cylindrical, conic), or specific to the individual projection? Snyder lays out rectangular coordinates in tables in his manual, but they don't seem to correlate with each other.

5
  • XKCD has a rather humorous approach to map projections xkcd.com/977 which is for the most part fairly accurate. There are many projections en.wikipedia.org/wiki/List_of_map_projections each mathematical model with their own strengths and weaknesses - Mercator, the one you have mentioned is usually used for navigation charts as bearings remain true but distances (therefore area) are not so good. There would only be a few here that would care to know what the math involved as the overwhelming majority use software to convert or display. Commented Feb 23, 2020 at 23:20
  • @MichaelStimson: I understand. I only used Mercator as an example to illustrate what I meant regarding the coordinate system for (x,y), but this is the case for all map projections that project a sphere (or ellipsoid) onto a plane. I'm still hopeful someone can explain why the (x,y) coordinates--presumably representing a planar suface--are in spherical coordinates.
    – marcman
    Commented Feb 23, 2020 at 23:40
  • are you working in a particular application? bc the interpretation of these concepts, by different applications is not all the same.
    – BJW
    Commented Feb 24, 2020 at 20:50
  • @BJW: What I am trying to do is write a small set of functions that can handle any map projection. I think that might be where I am going wrong to begin with. The idea I had was (1) create a pixel grid of the mapping surface in rectangular coords, (2) use an inverse projection of those coordinates to determine where to sample the unit sphere, and (3) render those samples from the sphere to the mapping surface. This works in some cases, but it seems that it is not as general as I'd like.
    – marcman
    Commented Feb 24, 2020 at 22:14
  • @BJW: I updated the question again to hopefully provide more clarity as to my objective
    – marcman
    Commented Feb 24, 2020 at 22:24

3 Answers 3

4

Coordinate system for different projection are usually in the mapping unit of the projection.

If you use a planar projection such as mercator, mapping unit is usually in meter (eg UTM) in some cases in feet.

The location of the origin (0,0 coordinate ) may vary for different projections and is defined by the false easting and false northing value. Usually the origin is shifted in such a way that all planar coordinates within the map extent are positive.

All planar projections always have an underlying geographic projection, based on a datum ( see a good explanation here https://gis.stackexchange.com/a/722/7716).

Geographic (spherical) coordinates are converted to projected (planar) coordinates based on the definition of the projection.

While planar coordinates are helpful to calculate the relative distance between objects or areas, they are often not meaning full to the average user. Usually they come ad very large numbers, representing the distance in map units from the map origin. If the user doesn't have this information he/she doesn't know where on earth the given location is. Often it is more convenient to use the underlying geographic coordinates to communicate the absolute location of an object.

In such cases, projected coordinates are converted back to geographic coordinates.

2

Projections are quite difficult to understand and it does not make it easier the fact that we will go through multiple coordinate systems during the transformation. Let's review the one involved in the Mercator and why the x = lambda - lambda_0 is a misleading simplification of the formula that migh make you think they are still spherical coordinates.

Spherical coordinates

This is a coordinate system for three-dimensional space where the position of a point is specified by three numbers: the radial distance of that point from a fixed origin, its polar angle measured from a fixed zenith direction, and the azimuthal angle of its orthogonal projection on a reference plane that passes through the origin and is orthogonal to the zenith, measured from a fixed reference direction on that plane.

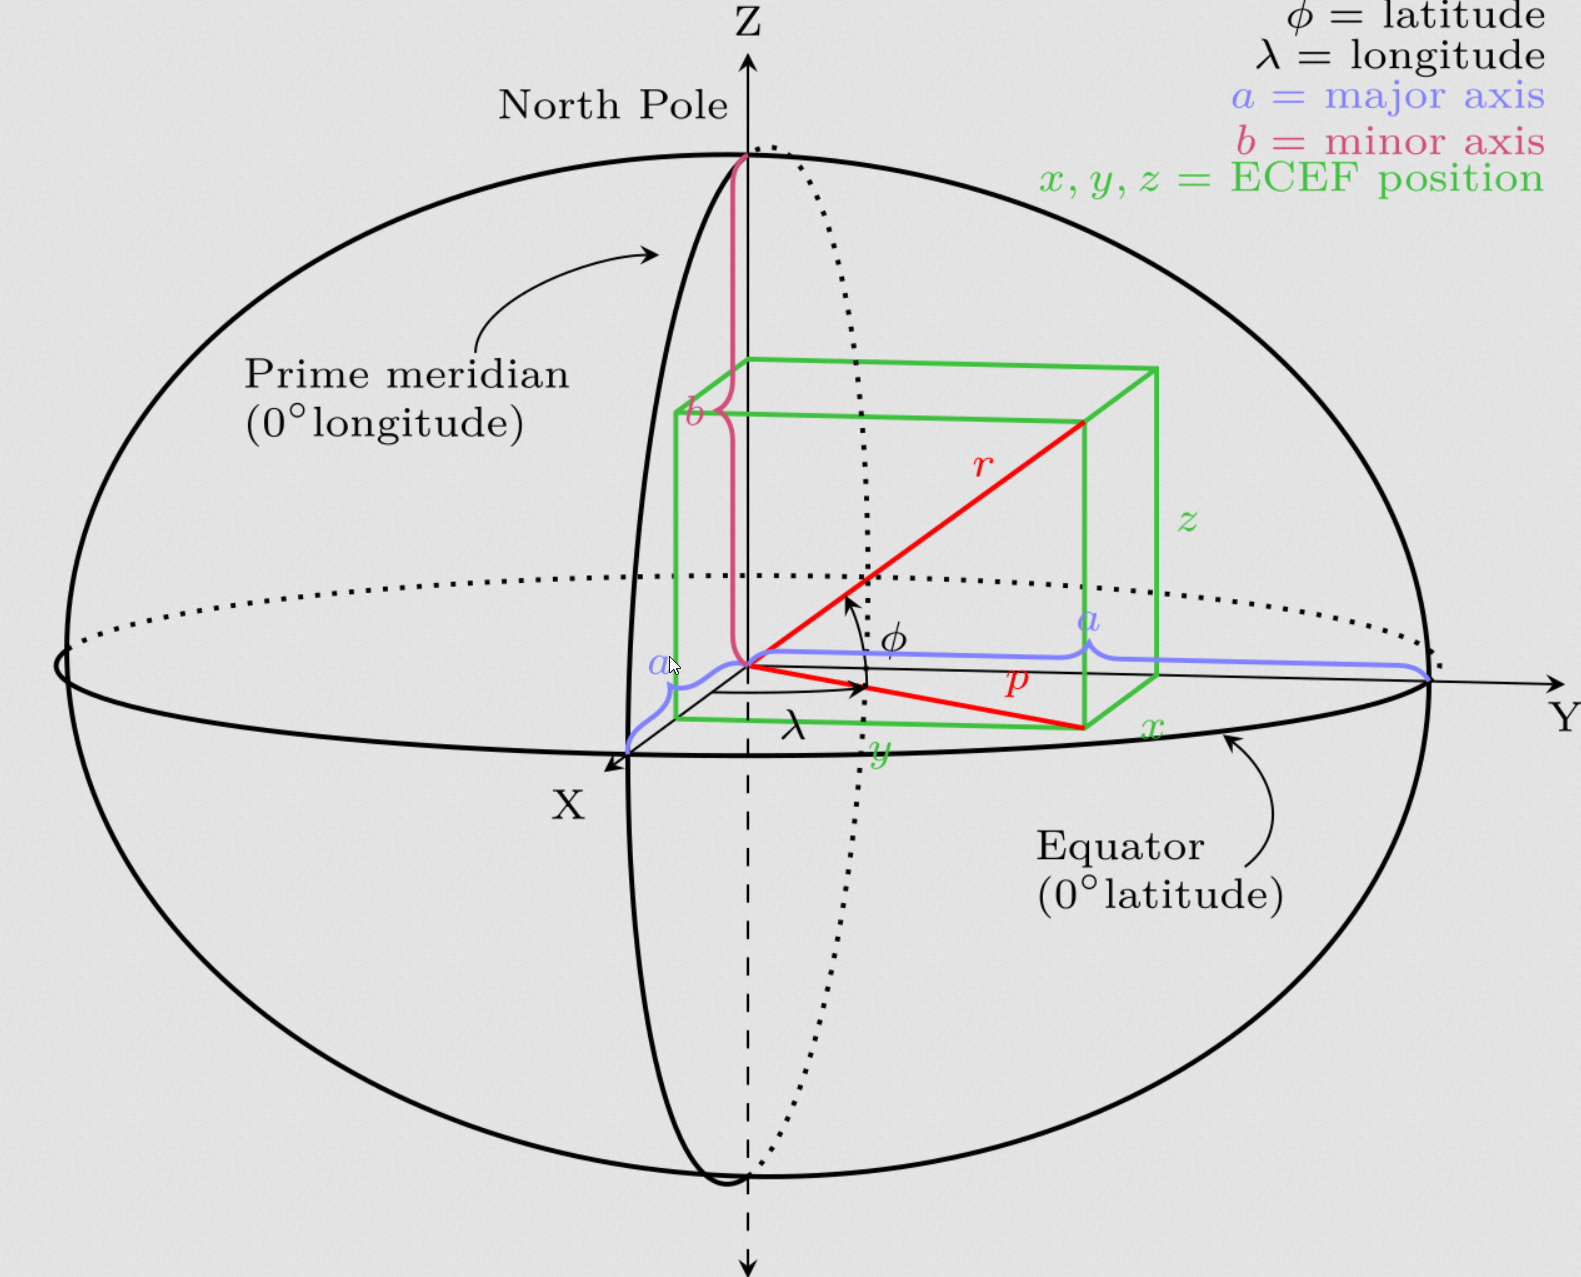
A common convention in mathematics (r, θ, φ) enter image description here

But in geography there is a special one starting with the fact that r has almost no interest, the main coorindates are Latitude (−90° ≤ φ ≤ 90°) and Longitude (−180° ≤ λ ≤ 180°)

Both coordinates are angles, so unitless.

enter image description here

Map projections

There are countless map projections, each one trying to achieve a minimal distortion on a feature important for the purpose of the map.

All of them transform a location coordinate on the globe, a spherical longitudinal latitude and unitless point in a surface that needs x and y with in a longitudinal unit.

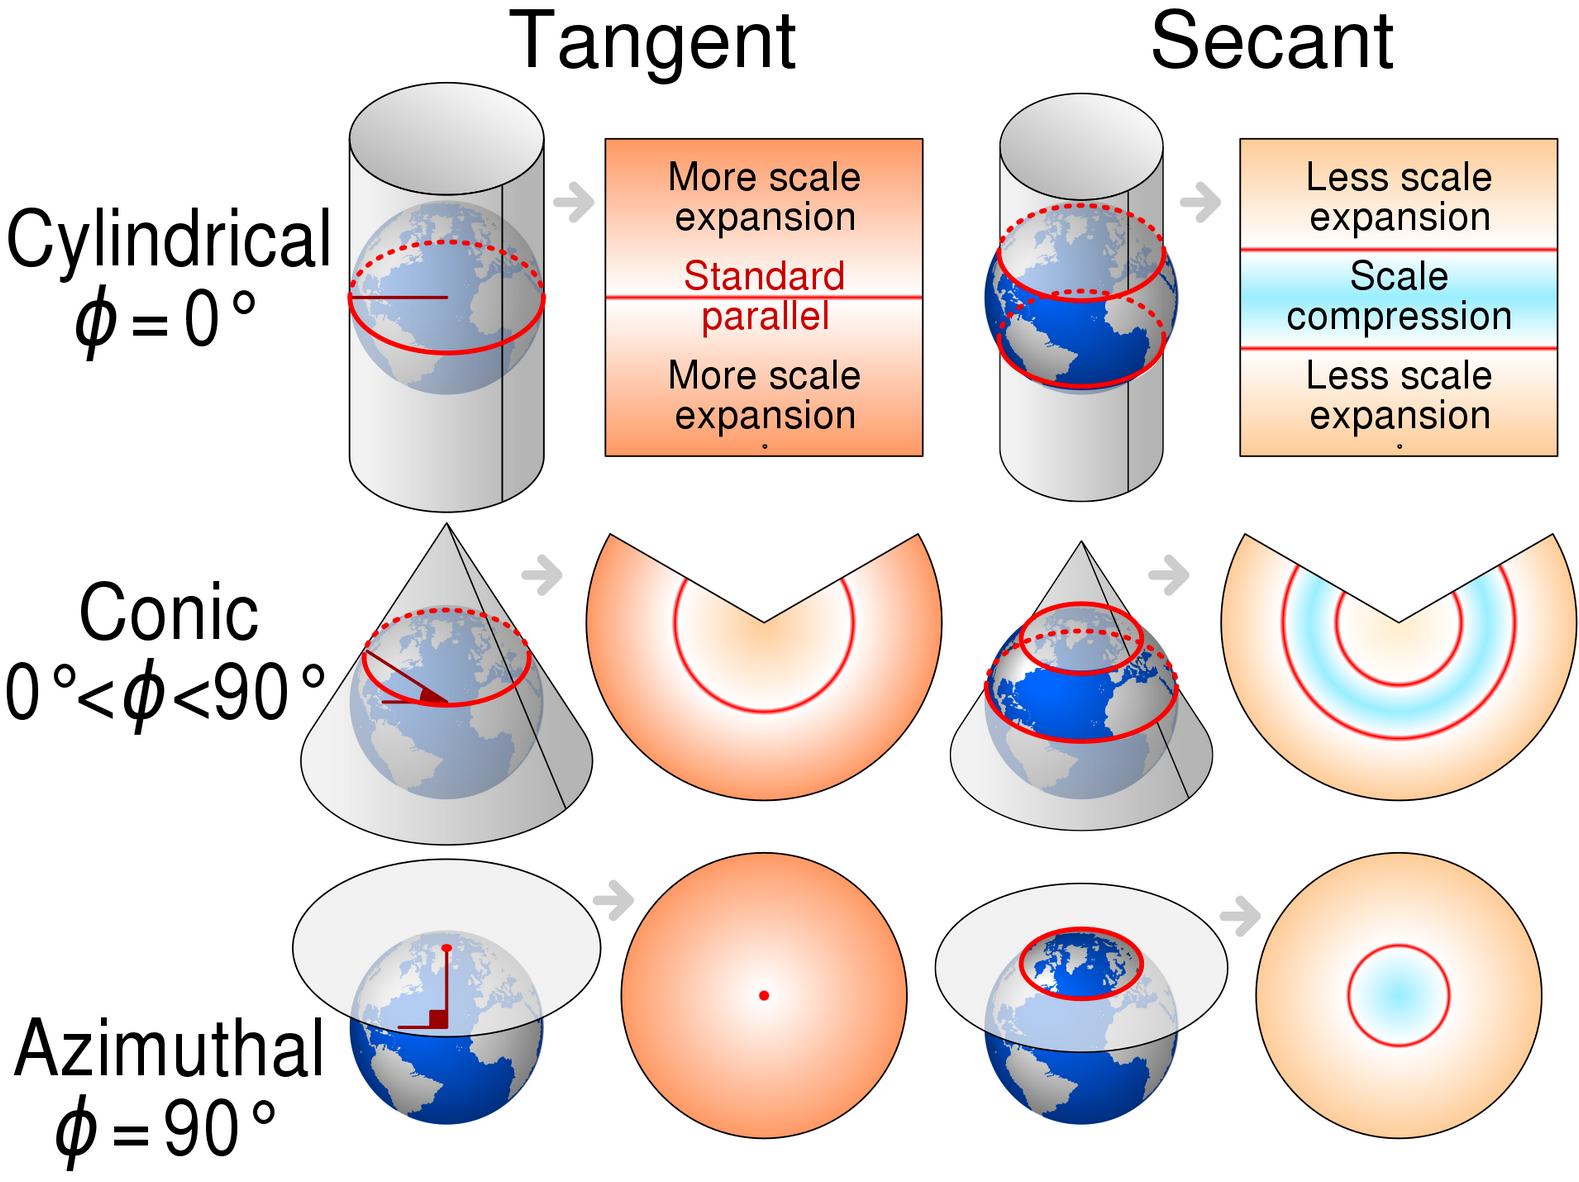
There are three projection families that are common in gepgraphy which might be useful to be familiar with: cylindrical (e.g. Mercator), conic (e.g. Albers), and plane (e.g. stereographic).

enter image description here

Cylindrical projections

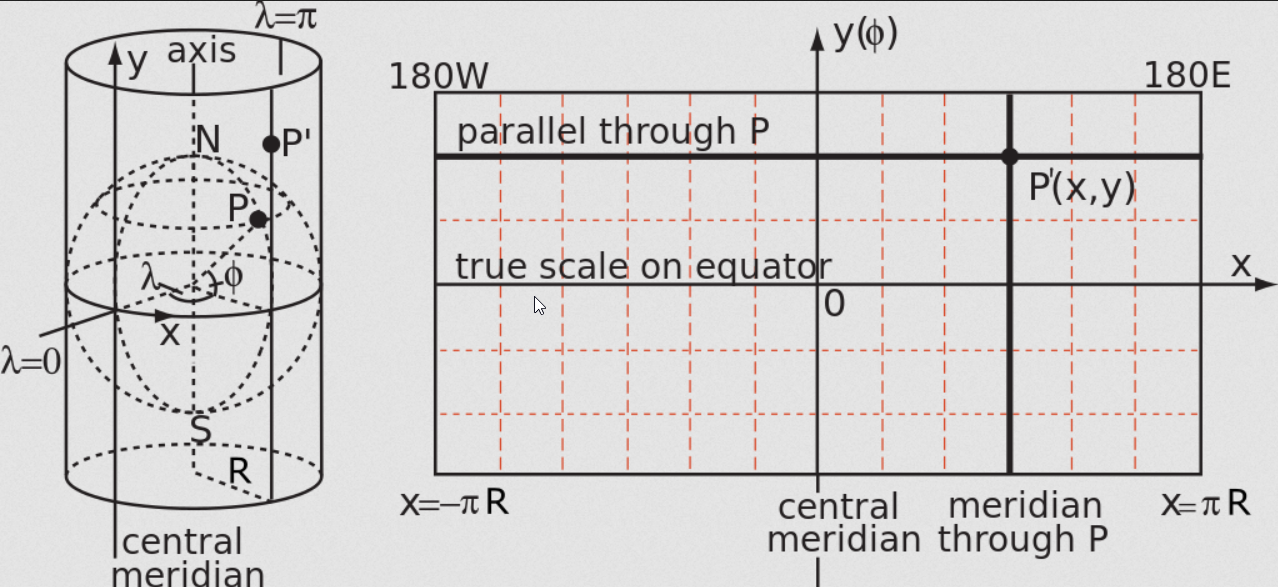
The cylindrical projection is one of the most common ones in geography, that is the case of the Mercator Projection you mention. A cylinder that wraps a sphere that when it is extended is a plan surface: a map!

enter image description here

From the image above you could deduce that the X coordinate is:

X=R (λ-λo)

with λ in radians and X in the same units of R.

Sources:

2
  • That definition of the projection is based on the unit sphere.

When the deformation produced by a projection is analyzed, it is very common to analyze the projection from a unit sphere (has Radius = 1 and is dimensionless).

It is not interesting in that analysis of which sphere it is, so you do not see the radius involved in the formula.

  • Latitude and longitude on the unit sphere do not have to be angular dimensions.

The formula of x = lambda - lambda_0 means: in that projection, any difference in longitude measures, over the projection plane, what an arc of equator of that angle measures.

But, how long (over the sphere surface) is that difference in longitudes on any parallel? The radius of the parallel is r = cos(phi), so the length of an arc of parallel is s = cos(phi) * (lambda - lambda_0), so the x deformation of Mercator projection is m = 1 / cos(phi).

That is, an arc of parallel in Mercator projection is not deformed at the equator, and deforms unitl the infinite in the poles (where the "real" arc measures 0).

The formula for the y axis, is the formula which gives Mercator projection its conformal property.

y deformation is "proportional" to x deformation, and when phi = pi/2, y tends to infinite.


Since the Earth is not a unit sphere, you will not be able to find a correspondence between your pixel locations and the geographical location that your pixels represent using those formulas.

If your projection is from a sphere, just multiply those formulas by the radius of the sphere and you will be able to do it.


Leaving aside the unit sphere, a map is a representation of a dimensional (but mathematical) object. From now on, we will call it: the Radius = 6378137m sphere.

A Mercator projection from the Radius = 6378137m sphere can't be a map, because it measures millons of meters. It is what I know as an image (in the calculus sense of image) of the mathematical object.

Starting with a dimensional mathematical object, we apply some function and find its image. That is what I think that is named Local scale in the figure included in the question. Its coordinate reference system units are meters, and it is centered at some (e.g., longitude 0 latitude 0 degrees) point. The relation between the object and its image, is the projection formula.

And there is where the scale comes in. A map is a scaled representation of that image. And that scale is E = units on the map / units on the projected image of the object. If the map is printed on a paper, you can think it as, for instance: 1 meter in the paper, 500 000 meters in the image. And yes, that scale is arbitrarily defined for practical purposes: you want to manually handle the map.

The coordinate reference system of the paper is related with the dimensional mathematical object in that way: a function is applied to the object to get its projection image, and a scale (and an origin reference) is applied to the projection image CRS to get the map reference system, in which you can say: "my point is ten centimeters on the right from the map paper origin".

That is (I think) the last process of the figure included in your question.

Replace the paper with the screen, and you will get the pixels coordinate reference system.

3
  • In my case, I am using the unit sphere. Is it fair, then, to generally say that the individual rectangular coordinate system is in relative coordinates? That is, it is an arbitrary scale that dictates only how far apart each coordinate is spaced on the projection? Additionally, that there is no equivalence between the rectangular coordinates of a Mercator projection and that of a Gnomonic projection, for example?
    – marcman
    Commented Feb 24, 2020 at 17:23
  • 1
    @marcman , I don't understand your questions. I included more information in my answer in an attempt to answer them. Commented Feb 24, 2020 at 21:02
  • I updated the question again to hopefully provide more clarity as to my objective
    – marcman
    Commented Feb 24, 2020 at 22:24

Your Answer

By clicking “Post Your Answer”, you agree to our terms of service and acknowledge you have read our privacy policy.

Not the answer you're looking for? Browse other questions tagged or ask your own question.