0

I'm looking for a methode in R to do the same thing as the ArcGIS Combine tool (Spatial Analyst).

The tool is explained here: https://pro.arcgis.com/fr/pro-app/tool-reference/spatial-analyst/combine.htm

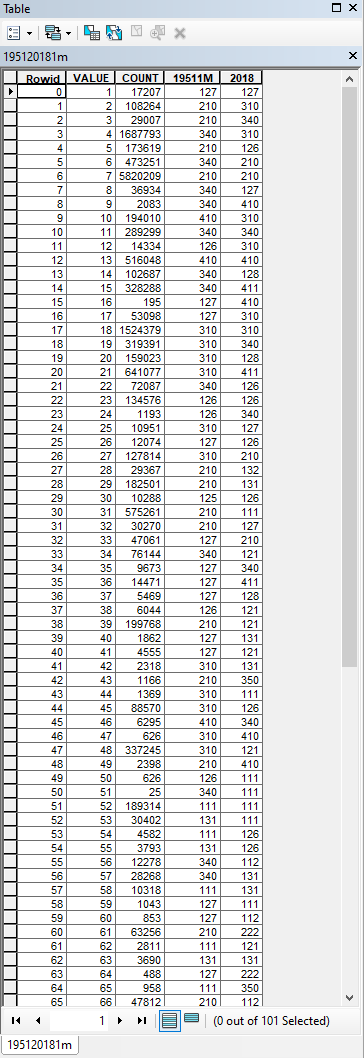
I aim to have the same results as I have already done with the combine tool in ArcGIS (see the attribute table).

Atribute Table

  • Count = number of pixels
  • 19911m = first raster (from 1951) with my typology code
  • 2018 = second raster (from 2018) with my typology code

This methode help me to see transitions (eiher stable on unstable) between the two rasters, between two dates.

As exemple, on the attribute table we can see :

127 (typology code ; raster 1951) to 127 (typology code ; raster 1951) = 17207 pixels

210 (typology code ; raster 1951) to 310 (typology code ; raster 1951) = 108264 pixels

PS: all my rasters have the same typology applied, same resolution, same area.

2 Answers 2

2

If I understood well, this tool is equivalent to R generic function table. Therefore, you can get every pixel combination by:

# open library raster    
library(raster)

# open your rasters
ras1<-raster('your_raster_1')
ras2<-raster('your_raster_2')

# create a dataframe beforehand in order to make code clearer  
df<-data.frame('ras1'=as.factor(as.matrix(ras1)), 'ras2'=as.factor(as.matrix(ras2)))
# calculate table
table(df$ras1, df$ras2)
2
  • Thanks, it seems to work. But the resulting table is a matrix. Is ther a way to represent the result as a table, like the one from arcgis (Count; Code Raster 1; Code Raster 2) ? Commented Apr 13, 2020 at 16:11
  • 3
    You can expand this into frequency counts of all combinations in a single call subset(as.data.frame(table(ras1[],ras2[])), Freq != 0) Commented Apr 13, 2020 at 18:13
1

I would recommend just coercing the raster stack to an sp object so that you have a data.frame two work with and operate from there.

Please note that I added a combine function into the development version of spatialEco 1.3-2 package. You can install the development version using remotes::install_github("jeffreyevans/spatialEco") Here is also a worked example that shows a way to work through the problem.

Create some integer data to combine

library(raster)
library(sp)

r1 <- raster(nrows=100, ncol=100)
  r1[] <- round(runif(ncell(r1), 1,4),0)
r2 <- raster(nrows=100, ncol=100)
  r2[] <- round(runif(ncell(r2), 2,6),0)  

We coerce the rasters to an sp class pixels object. Note that I am stacking the rasters so they will be combined into a single object. The columns represent the pixel values of each raster in the stack and each row is a pixel.

r <- as(stack(r1,r2), "SpatialPixelsDataFrame")
  head(r@data)

Now, we simply use something like paste to combine all possible combinations at the pixel level. You can check the unique combinations by using unique.

r@data <- data.frame(value=as.numeric(factor(paste(r@data[,1], 
                     r@data[,2], sep=""))), r@data)    
  head(r@data)
  sort(unique(r$value)))

Subset to a value to validate single combinations

r@data[r$value == unique(r$value)[1],] 

This is how to structure the data in R for analytical purposes. However, if you would like a summary that resembles the ESRI table that results from combine the you can operate on the data.frame in the sp object.

subset(as.data.frame(table(r@data)), Freq != 0)

This sp object can also be coerced back to raster by simply using stack.

r <- stack(r)
  unique(r[[3]][])

Your Answer

By clicking “Post Your Answer”, you agree to our terms of service and acknowledge you have read our privacy policy.

Not the answer you're looking for? Browse other questions tagged or ask your own question.