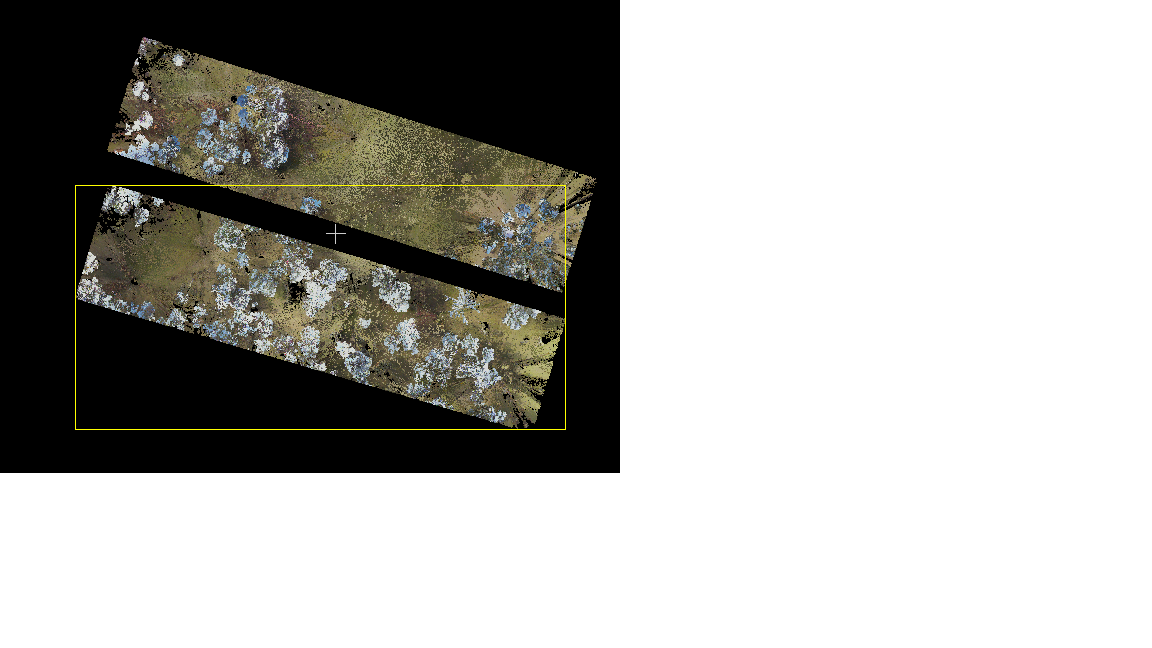
I have 96 1 ha (200m by 50 m) plots that I collected TLS data (each file separate). Most of the plots are close to each other and therefore they have overlapping bounding boxes (point clouds don't overlap themselves). I would like to calculate some grid metrics for all 96 plots using lidR package.
ctg <- readLAScatalog("infolder", filter = "-drop_z_above 1.3 -drop_class 2", chunk_size = 0,
                      chunk_buffer = 0)
opt_chunk_size(ctg) <- 0
opt_chunk_buffer(ctg) <- 0
opt_output_files(ctg) <- "outfolder/{ORIGINALFILENAME}"
summary(ctg)

hmean <- grid_metrics(ctg, mean(Z), 0.1)
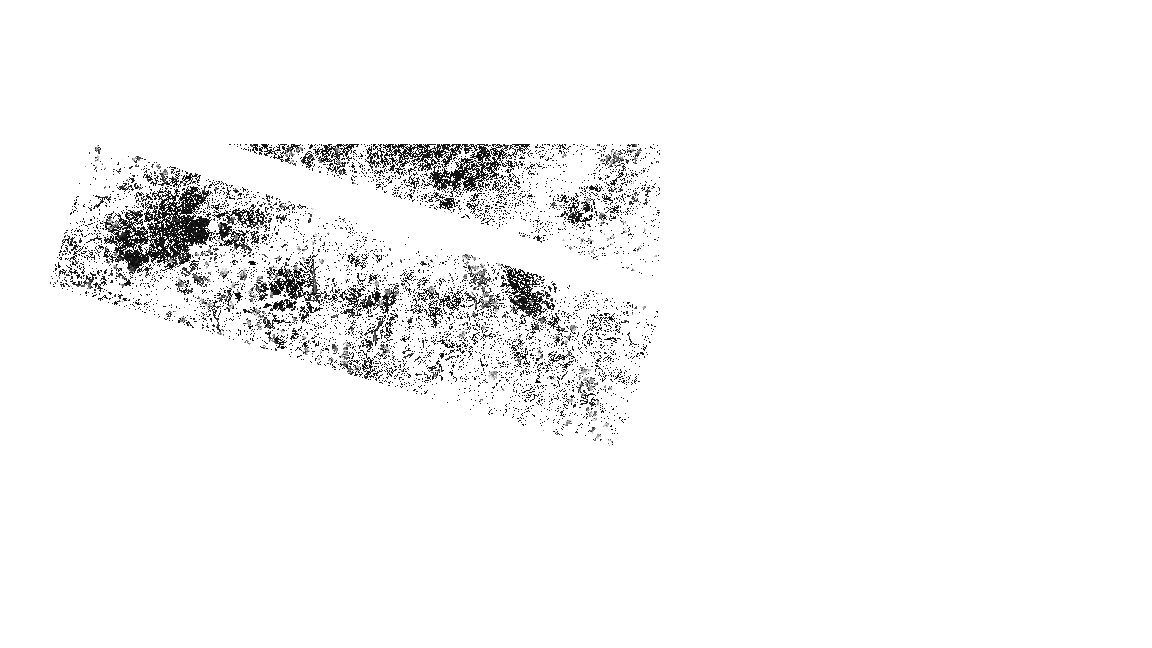
Since I am giving chunk size of 0, catalog class considering bounding boxes as tiles and calculating metrics based on the bounding boxes. For this reason, I am getting raster image of a file which also includes part of neighboring image. Also, following warning message from R also referred to this problem.
Be careful, some tiles seem to overlap each other. lidR may return incorrect outputs with edge artifacts when processing this catalog.
If I want to make small chunks, size of 10m, lidR gives warning:
Be careful, a chunk size smaller than 250 is likely to be irrelevant.
Be careful, some tiles seem to overlap each other. lidR may return incorrect outputs with edge artifacts when processing this catalog.
How to calculate grid metrics for each file separately in my case?


