0

I'm using the Python API of GEE and I try to display my results in a PDF file. I'd like to create it with matplotlib so that I can check my figure before exportation. To add a little context :

I create an image using :

task_config = {
    'image':clip,
    'description':description,
    'scale': 30,
    'region':buffers[index],
    'maxPixels': 1e12
}
    
task = ee.batch.Export.image.toDrive(**task_config)
task.start()

I can display this image in QGIS: enter image description here
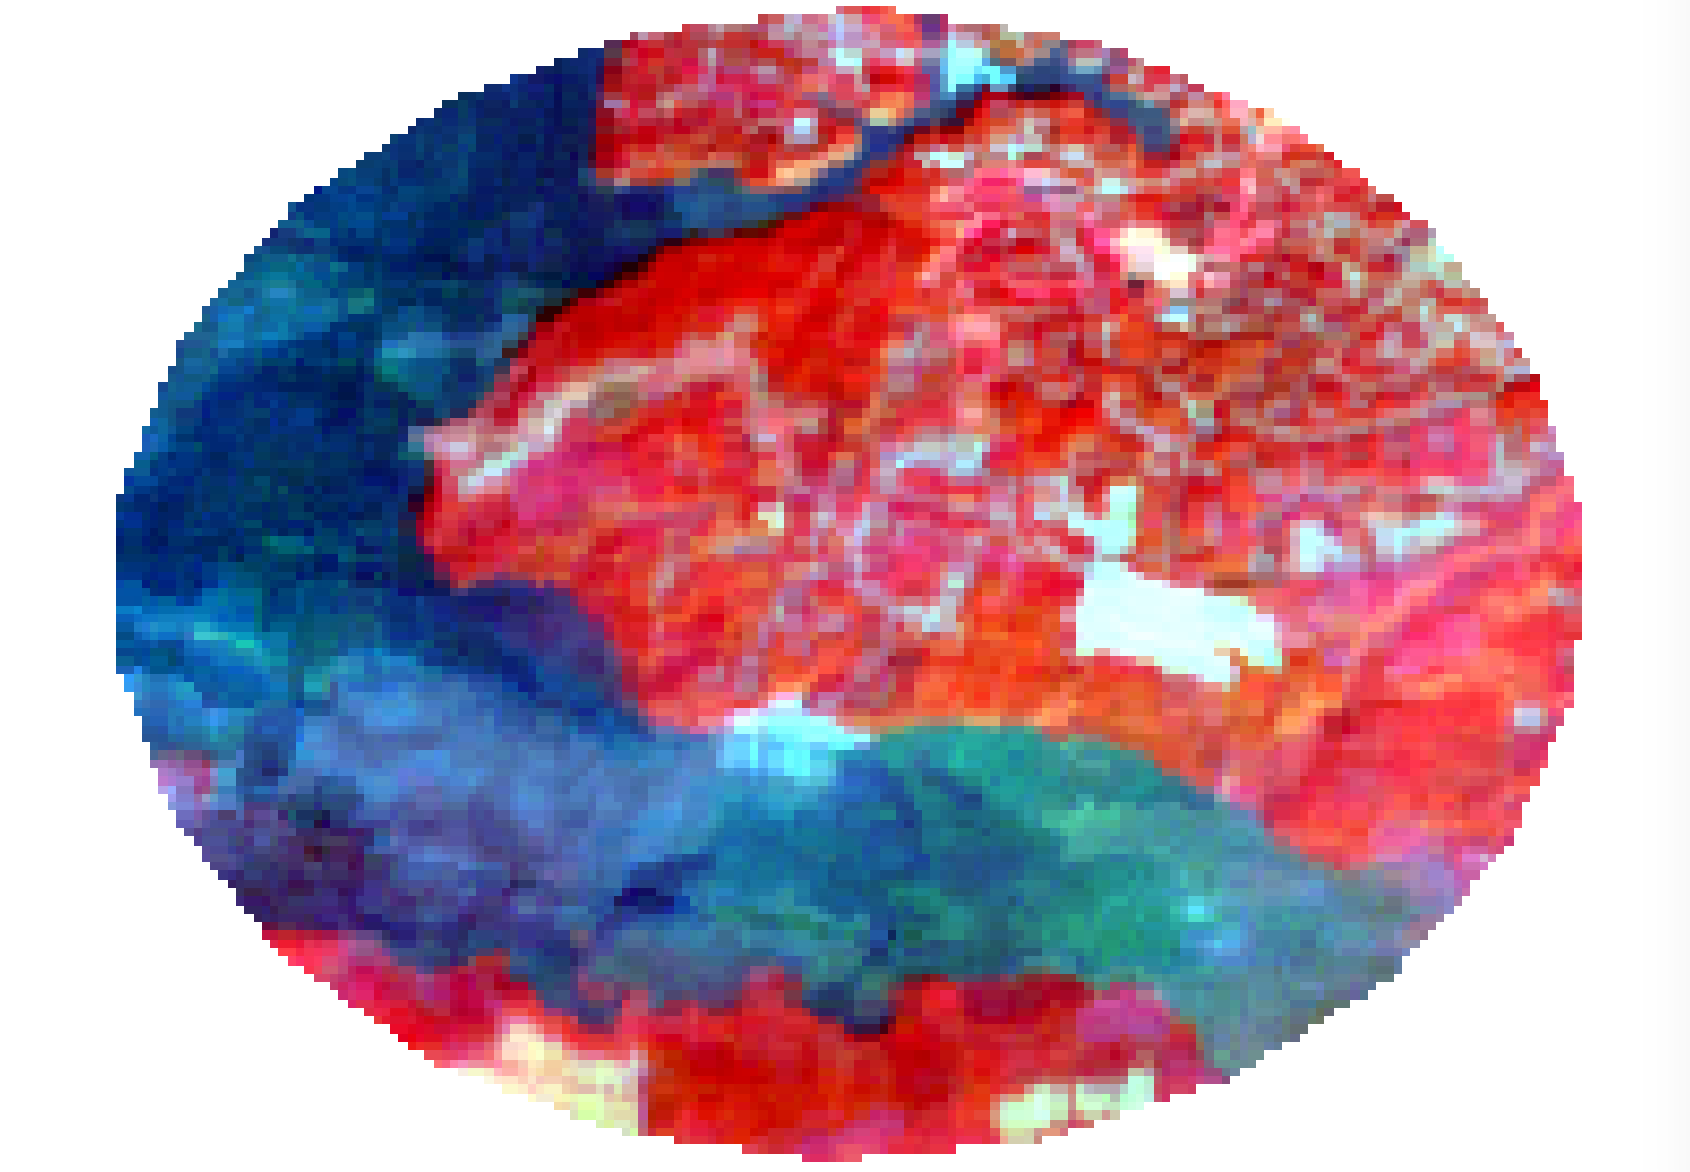
Then I download it to my local folder and try to read it with matplotlib:

img = plt.imread(file)
plt.imshow(img)
plt.show()

I get the following error :

UnidentifiedImageError: cannot identify image file '/home/prambaud/time_series_results/tmp/test_pts_pt_0_Red_Green_Blue_2005.tif'

Is it normal? Is there another way to open Images that are generated by GEE ?

1
  • Quote from the matplotlib imread docs: "Matplotlib can only read PNGs natively. Further image formats are supported via the optional dependency on Pillow. Note, URL strings are not compatible with Pillow. Check the Pillow documentation for more information.". You may use GDAL to read tif files.
    – Zoltan
    Commented Aug 13, 2020 at 7:03

1 Answer 1

0

It requires a bit more manipulation but in the end it worked :

import rasterio as rio
import numpy as np
from matplotlib import pyplot as plt

with rio.open(file) as f:
    data = f.read()
                
    bands = [] 
    for i in range(3):
        band = data[i]
        #remove the NaN from the analysis
        # 3000 is the unit for landsat data change it according to your need
        h_, bin_ = np.histogram(band[np.isfinite(band)].flatten(), 3000, density=True) 
    
        cdf = h_.cumsum() # cumulative distribution function
        cdf = 3000 * cdf / cdf[-1] # normalize
    
        # use linear interpolation of cdf to find new pixel values
        band_equalized = np.interp(band.flatten(), bin_[:-1], cdf)
        band_equalized = band_equalized.reshape(band.shape)
        
        bands.append(band_equalized)
    
    data = np.stack( bands, axis=0 )

    data = data/3000
    data = data.clip(0, 1)
    data = np.transpose(data,[1,2,0])
    plt.imshow(data, interpolation='nearest')
    plt.show()

Your Answer

By clicking “Post Your Answer”, you agree to our terms of service and acknowledge you have read our privacy policy.

Not the answer you're looking for? Browse other questions tagged or ask your own question.