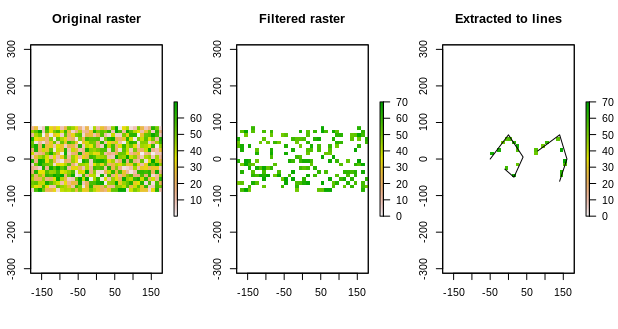
As previously commented, you may accomplish all your task using R exclusively; in the following code, a raster is created and then filtered to values above the threshold, all other values will become NA, then the pixels are masked to the lines. Raster works now in recent versions with both sf and sp objects, the code uses the latter kind.
library(raster)

r <- raster(ncol = 36, nrow = 18, vals = runif(648, min = 0, max = 70))
cds1 <- rbind(c(-50,0), c(0,60), c(40,5), c(15,-45), c(-10,-25))
cds2 <- rbind(c(80,20), c(140,60), c(160,0), c(140,-55))
lines <- spLines(cds1, cds2)


par(mfrow = c(1,3))
plot(r, main = "Original raster")
# to filter out values < 60
r[r[] < 50 ] = NA # check the use of braces to acces values of the raster
plot(r, zlim = c(0,70), main = "Filtered raster")

# to get the values of pixels that touch the lines
extract(r, lines)

# to filter the rasters to the lines
rf = mask(r, lines)
plot(rf, main = "Extracted to lines")
plot(lines, add = T)


rasterand ```sf```` libraries in R. I am however open to work with the other two:)