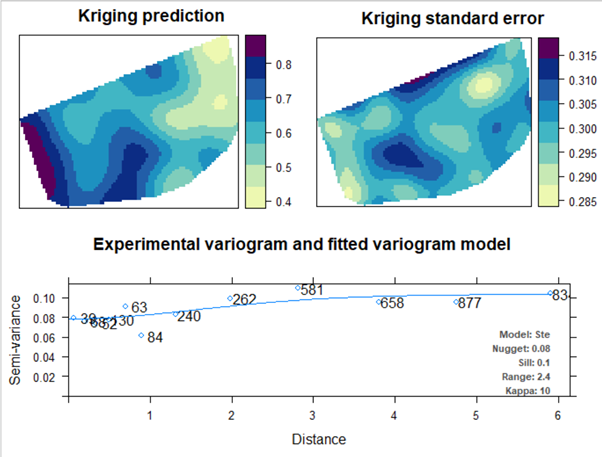
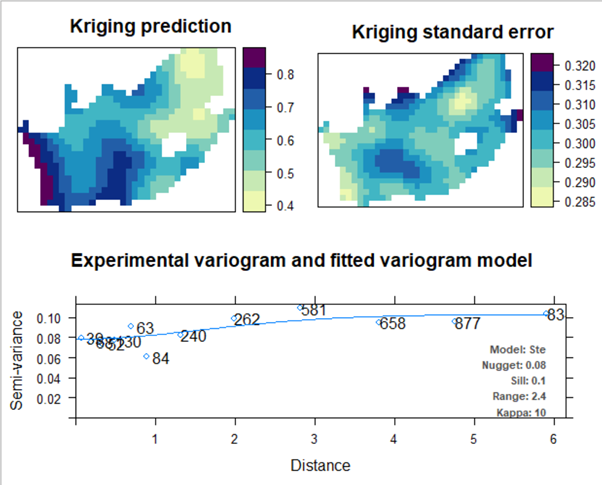
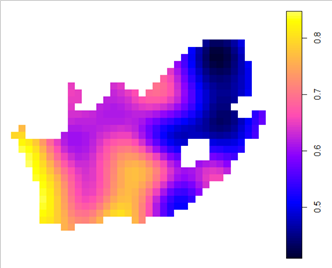
I am trying to conduct kriging of variable called percent in South Africa.
   head(LL12)

     Location Longitude  Latitude   percent
    1       L1  16.48476 -28.60737 1.0000000
    2       L3  16.90045 -29.24154 1.0000000
    3       L4  16.99268 -28.44906 0.6363636
    4       L5  17.06871 -29.67825 1.0000000
    5       L6  17.09935 -29.00169 0.6000000
    6       L7  17.25630 -28.82418 1.0000000
I got the grid as follows:
       SAgrd <- makegrid(SApol_border, n = 1000)
       colnames(SAgrd) <- c('lon','lat')

    SAgrd_pts <- SpatialPoints(coords = SAgrd,
                       proj4string=CRS(proj4string(SApol_border)))


    SAgrd_pts_in <- SAgrd_pts[SApol_border, ]
    plot(SAgrd_pts_in)
# change to shorter name and transform
        SA.grid = SAgrd_pts_in

# transform grid to s.pix.d.f.
        SA.grid=as(SA.grid,"SpatialPixelsDataFrame")

# Ordinary kriging, no new_data object (automap)
# obtain a spdf

        coordinates(LL12) <- ~ Longitude + Latitude
        LL12spdf <- LL12  # indicate the data is a spdf

        krigLL12 = autoKrige(percent~1, LL12spdf)
thus far, good. The above renders a graphic.

However I want to obtain a better graphic where the points are within the frame boundaries/shape of the country. Then I fit a variogram with automap:
LL12vgm <- autofitVariogram(percent~1, LL12spdf)
Then use the fitted variogram and the grid in ordinary kriging (https://rdrr.io/cran/automap/man/autoKrige.html):
L12_am_krg = autoKrige(percent~1, LL12spdf, SA.grid)
however I get the following error message:
Error in autoKrige(percent ~ 1, LL12spdf, SA.grid) :
  Either input_data or new_data is in LongLat, please reproject.
   input_data:  NA
   new_data:    +proj=longlat +ellps=WGS84 +towgs84=0,0,0,0,0,0,0 +no_defs
In addition: Warning messages:
1: In proj4string(new_data) :
  CRS object has comment, which is lost in output
2: In proj4string(new_data) :
  CRS object has comment, which is lost in output
3: In showSRID(uprojargs, format = "PROJ", multiline = "NO") :
  Discarded datum Unknown based on WGS84 ellipsoid in CRS definition,
 but +towgs84= values preserved
Then I tried using gstat and the fitted variogram :
L12.kriged <- krige(percent ~ 1, LL12spdf, SA.grid, model=LL12vgm$var_model)
and I get the following error message 1 NA 1 "+proj=longlat +ellps=WGS84 +towgs84=0,0,0,0,0,0,0 +no_defs"
Error in predict.gstat(g, newdata = newdata, block = block, nsim = nsim,  :
  var1 : data item in gstat object and newdata have different coordinate reference systems
In addition: Warning messages:
1: In proj4string(newdata) :
  CRS object has comment, which is lost in output
2: In proj4string(newdata) :
  CRS object has comment, which is lost in output
I would prefer to use the automap for its simplicity. It looks like I need to reformat the grid file but I cannot figure out how. I am a novice in these topics.


