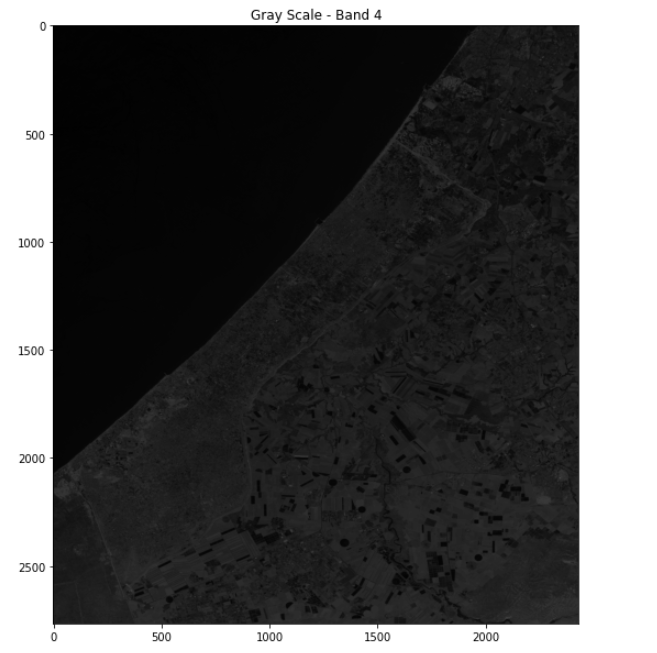
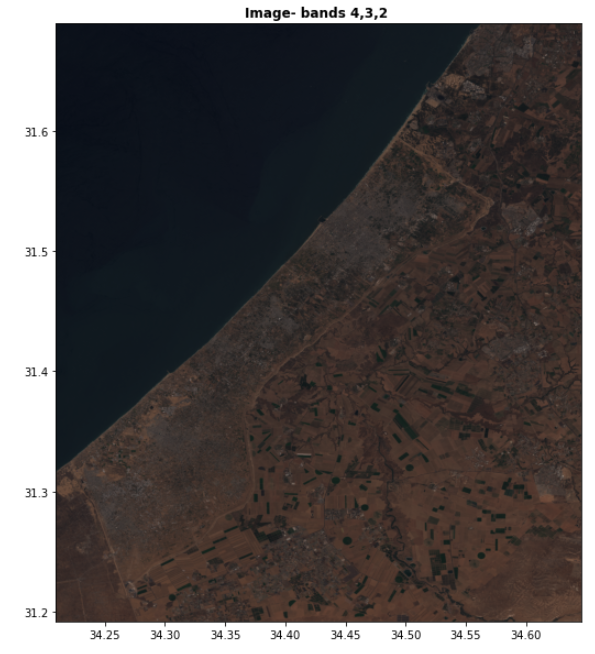
I have sentinel 2 image and I use rasterio to display it. I am using "imshow" to display it. when I display it, it doesn't show any coordinates:
src=rasterio.open('14072020.tif')

#Display the image
plt.figure(figsize=(20,10))
plt.imshow(src.read(4), cmap='gray')
plt.title('Gray Scale - Band 4')
I have ried to add it like this:
plt.imshow(src.read(4),transform=src.transform, cmap='gray')
but then I get error message:
TypeError: 'transform' must be an instance of matplotlib.transforms.Transform, not a affine.Affine
the weird thing is that if I display 3 bands together it appears:
#RGB image
plt.figure(figsize=(20,10))
show(src.read([4,3,2]),transform=src.transform,title='Image- bands 4,3,2 IN 0-255 Values',vmin=0,vmax=30000)
Why is this happen? is there any way I can control add coordinates to the one band image?


