2

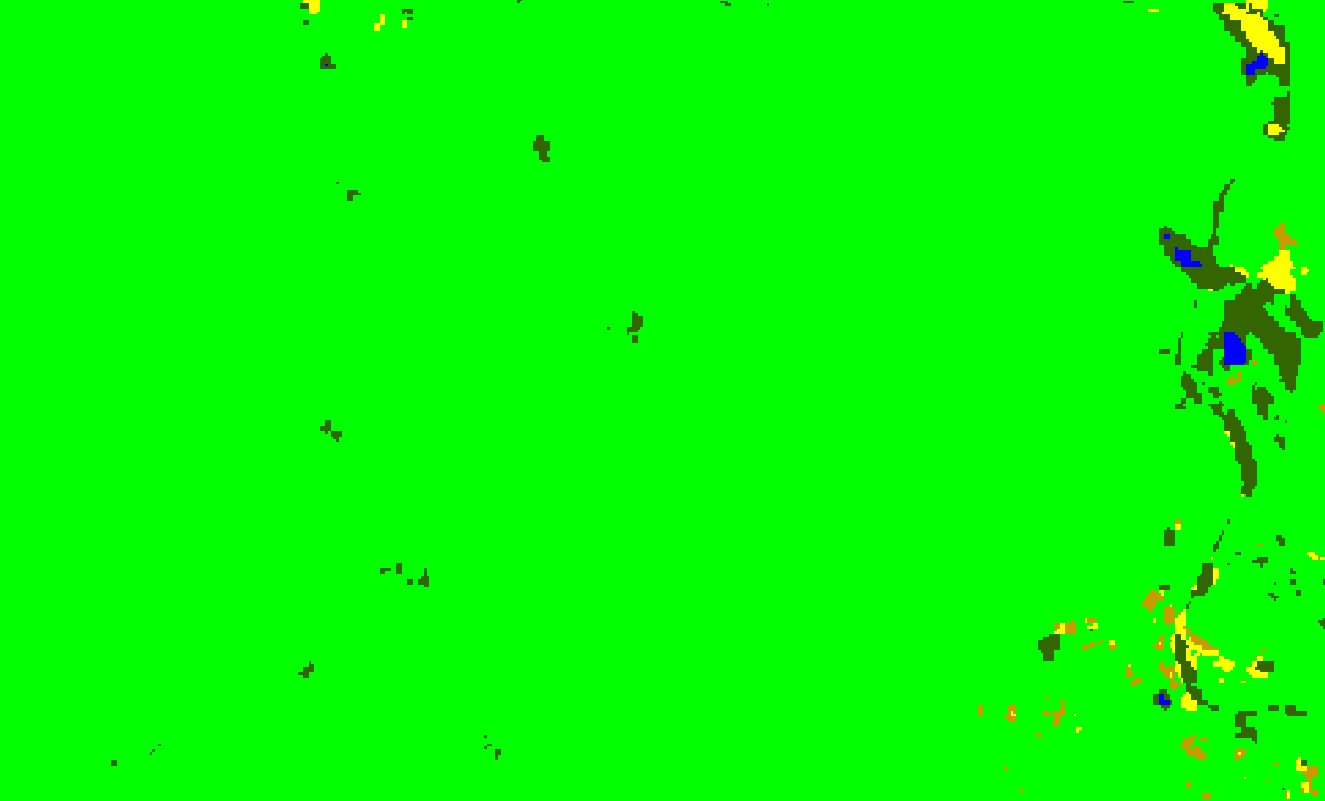
I am using QGIS 3.16 and I have an int ratser tiff file, which shows classified land covers obtained from Sentinel-2. I need to create polygons over each class to classify and visualize each group in a vector format. As shown in the image attached, the areas corresponding to each class are so scattered and there is not just this one image so I cannot draw polygons manually. I thought of using an specific field in the attribute table to separate a class, but it does not have an attribute table! Any ideas on how I can vectorize a raster based on its different class colors?

enter image description here

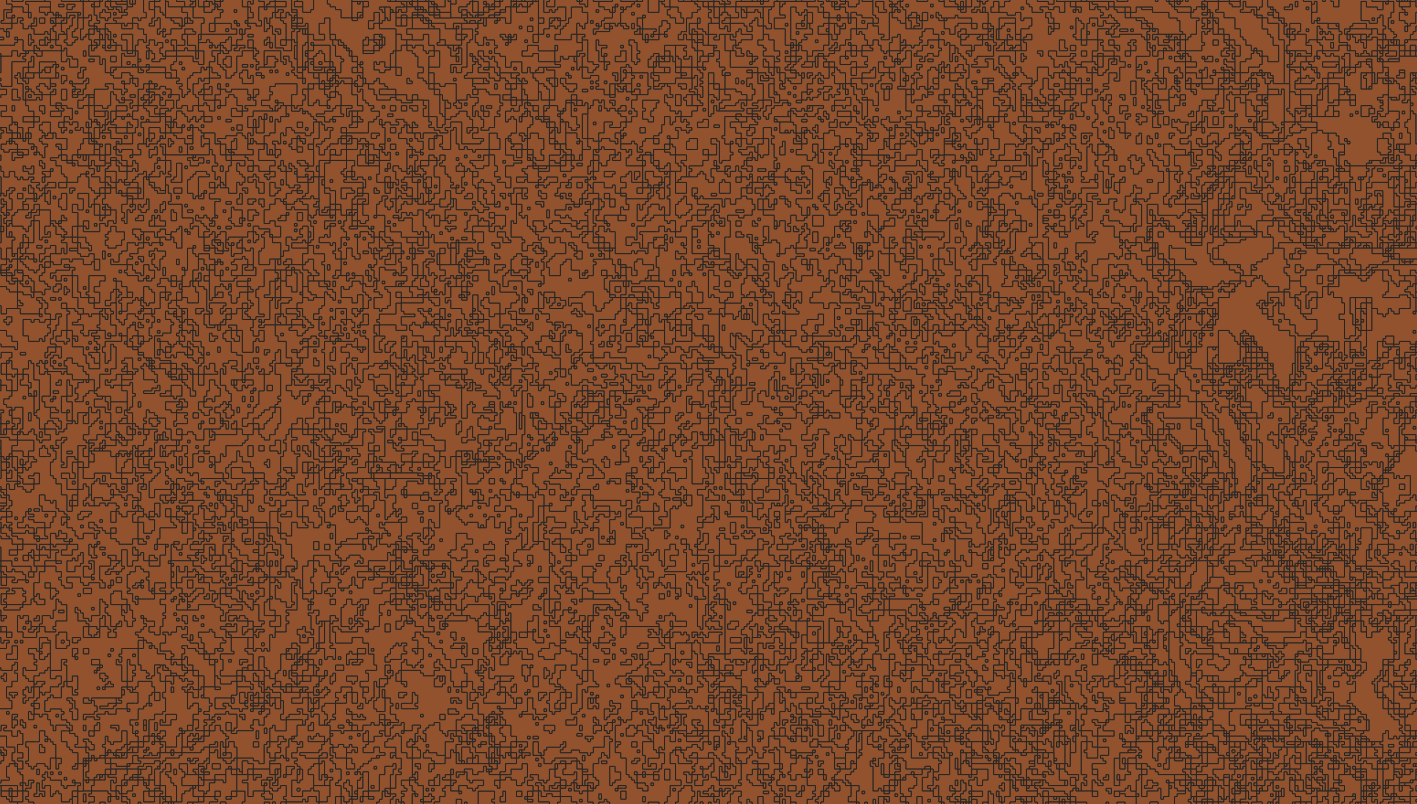
The zoomed in result from using polygonize tool under GDAL>raster conversion is like below over the same area. For example, all the light green area which is just one class, shows many many polygons instead of just one big polygon over the light green area

enter image description here

enter image description here

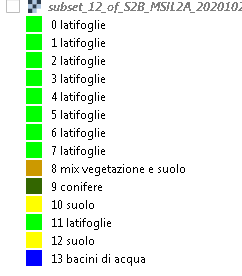
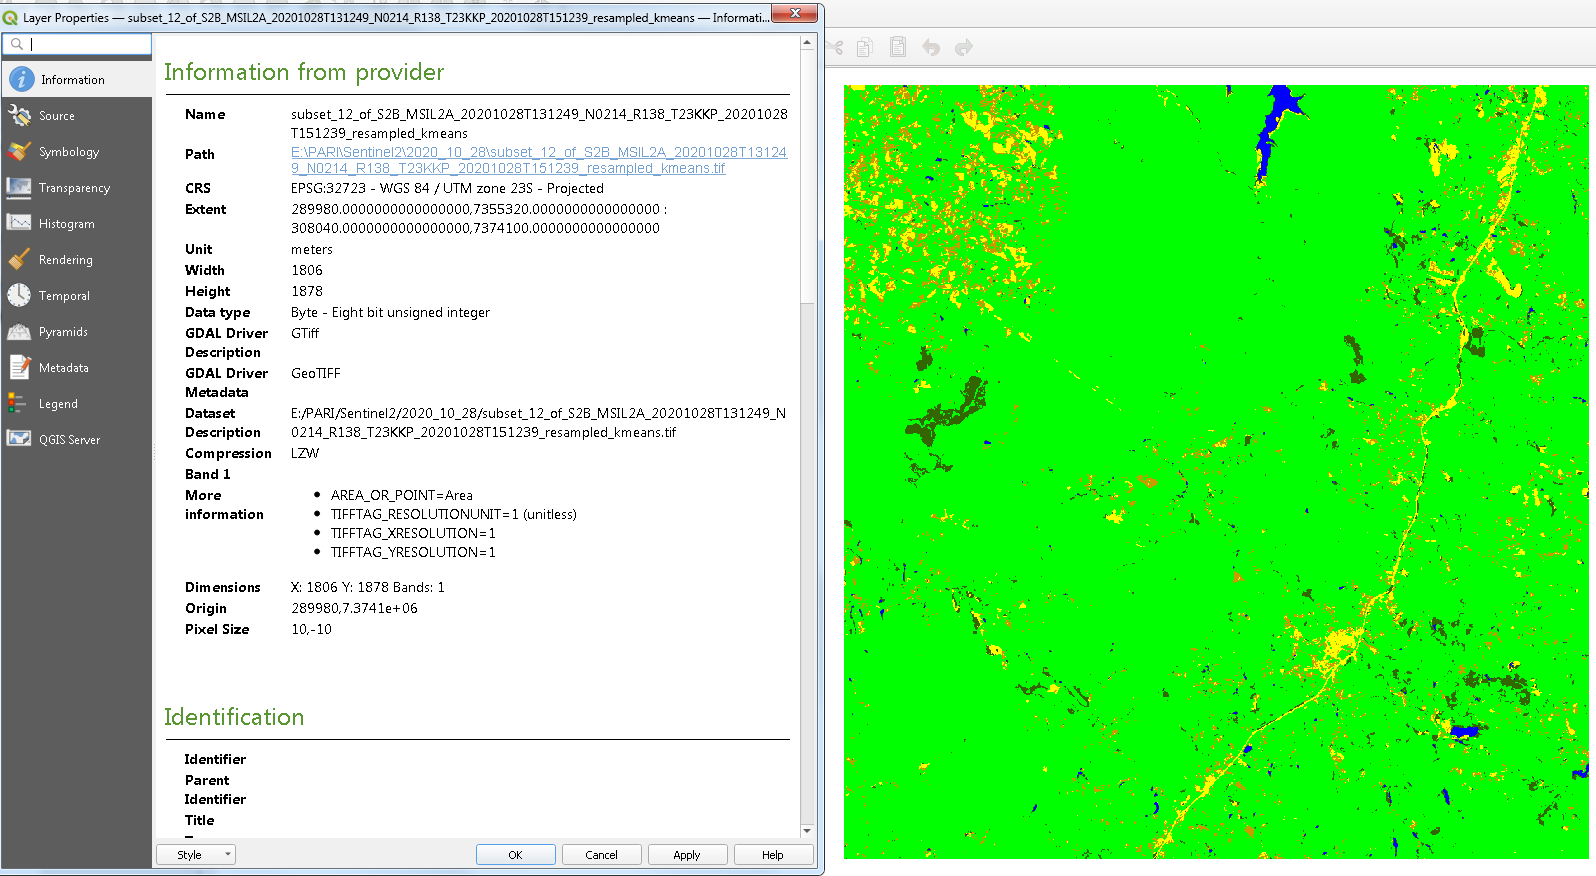
The ratser is classified as below:

enter image description here

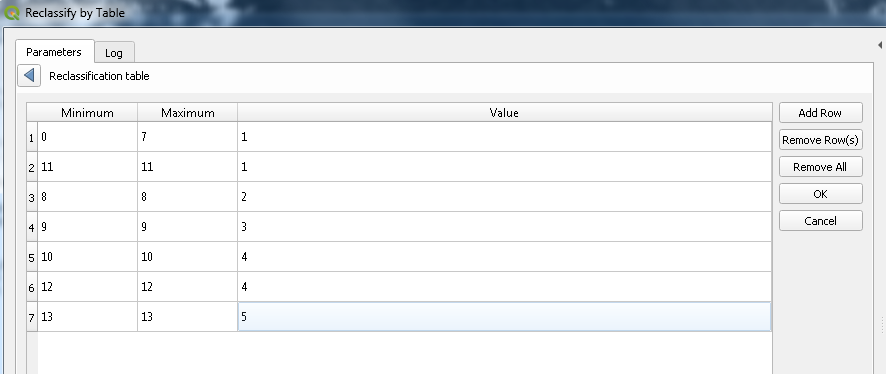
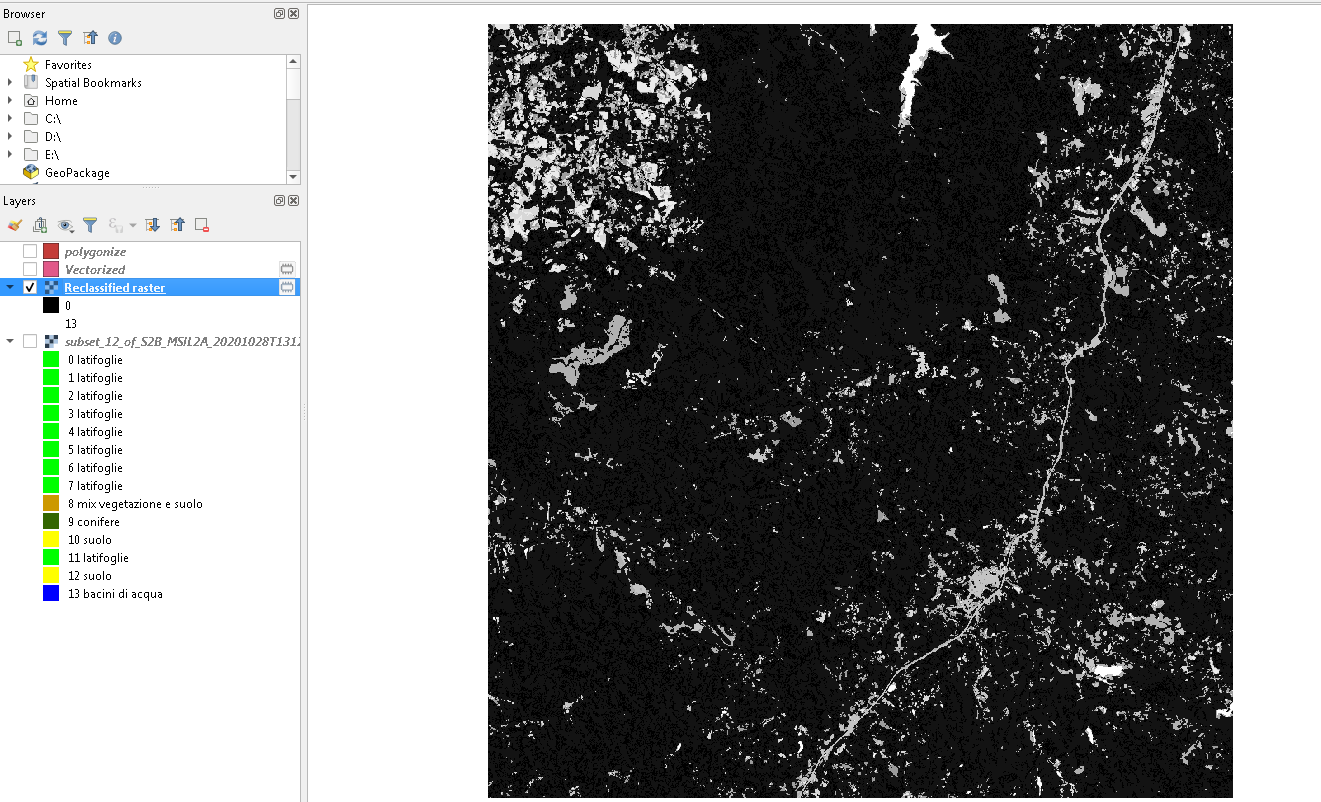
I wrote this classification table and I got this result which only has to values of 0 and 13 instead of 1 to 5 that I was expecting:

enter image description here

enter image description here

15
  • 2
    Just polynonize the raster. A separate polygons will be created for all distinct raster values. Value will be written into an attribute.
    – user30184
    Commented Nov 20, 2020 at 9:54
  • 2
    Reclassify your raster so for example all your light green areas get the same value then vectorize. As of now I'm guessing your light green values actually have different values but you grouped them together in the styling so for example values from 10-100 are light green
    – Bera
    Commented Nov 20, 2020 at 10:21
  • 1
    Thansk @BERA. You are right. There were 6 classes with the same green color. For performing your suggestion, I found the Reclassify by layer and table tools but I guess I cannot use these options because I dont have a layer containg class breaks or classification table. I am better with Arcmap but I am new with QGIS.
    – Paris
    Commented Nov 20, 2020 at 10:43
  • 1
    Within the reclassify table you can define your own class breaks in the classification table
    – MarcM
    Commented Nov 20, 2020 at 10:50
  • 1
    You can try this: use 1 row to classify values from 0 - 7 to "1" then define a separate row to classify 11 - 11 to "1". Same for soil (=suolo).
    – MarcM
    Commented Nov 20, 2020 at 11:05

1 Answer 1

3

Following from the discussion and chat:

First, reclassify your raster data using Reclassify by table with range boundary "min <= value <= max". For each interval use 1 row, according to your classes e.g.;

row 1: (0 - 7) = 1,

row 2: (11 - 11) = 1.

Then polynonize your raster. Finally, symbolize your vector layer using, Properties > Symbology and make it "Categorized" using the new class values of 1-5.

Your Answer

By clicking “Post Your Answer”, you agree to our terms of service and acknowledge you have read our privacy policy.

Not the answer you're looking for? Browse other questions tagged or ask your own question.