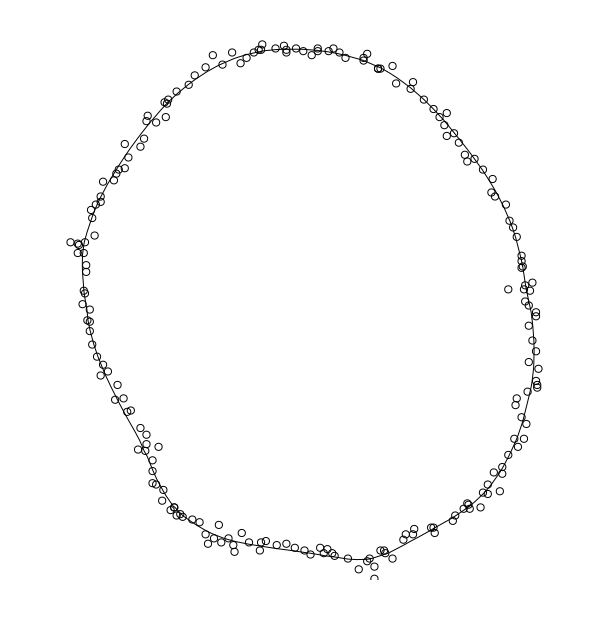
Another method - fit a smoothed line based on polar coordinates of the points from the centroid.
Ingredients: a function to convert x,y to r,theta from the centroid of a set of points:
polar <- function(pts,centre){
    pts = st_coordinates(pts)
    theta = atan2(pts[,2]-centre[,2], pts[,1]-centre[,1])
    r = sqrt((pts[,1]-centre[,1])^2 + (pts[,2]-centre[,2])^2)
    data.frame(theta=theta, r=r)
}
A function to take the points, call the polar conversion, then fit a smoothed line to the polar coordinates, then transform and shift back to cartesian coordinates and make a polygon:
fitline <- function(pts){
    centre = st_coordinates(st_centroid(st_union(pts)))
    rt = polar(pts,centre)
    rtsmooth  = supsmu(rt$theta, rt$r)
    xysmooth = cbind(centre[,1]+rtsmooth$y*cos(rtsmooth$x),
                     centre[,2]+rtsmooth$y*sin(rtsmooth$x))
    xysmooth = rbind(xysmooth, xysmooth[1,])
    st_polygon(list(xysmooth))
}
To test on my sample data:
> tree = fitline(pts)
> plot(tree)
> plot(pts, add=TRUE)

This line has a length of:
> st_length(st_cast(tree,"LINESTRING"))
[1] 1.958053
The only tuning this method needs is to control the degree of smoothing. Lots of other smoothing functions could be used, I've used supsmu since its in the base R packages and is pretty much guaranteed to do something reasonable.
Ideally you'd fit a periodic function so that your line joins up at the 360-0 degree gap but with dense enough data this probably isn't a problem.


