2

I have a sample .csv file (sample download) that I am trying to convert to a gridded raster. So far, I have used two methods, one of the methods is explained in the answer here. But, I am running into problems, how can I fix this problem in R? The code for the first method is as follows:

# CSV to raster
library(raster)
# sample data
sample <- read.csv("Sample_Data.csv", header=TRUE)
x <- raster(xmn=-110.906, xmx=-110.031, ymn=43.03938, ymx=44.3438, res=0.0625, crs="+proj=longlat +datum=WGS84")
rstr <- rasterize(sample[, c('X', 'Y')], x, sample[, 'VIC_SC_04'])
plot(rstr)

This code results the plot nelow and as you can see it's not gridded. enter image description here
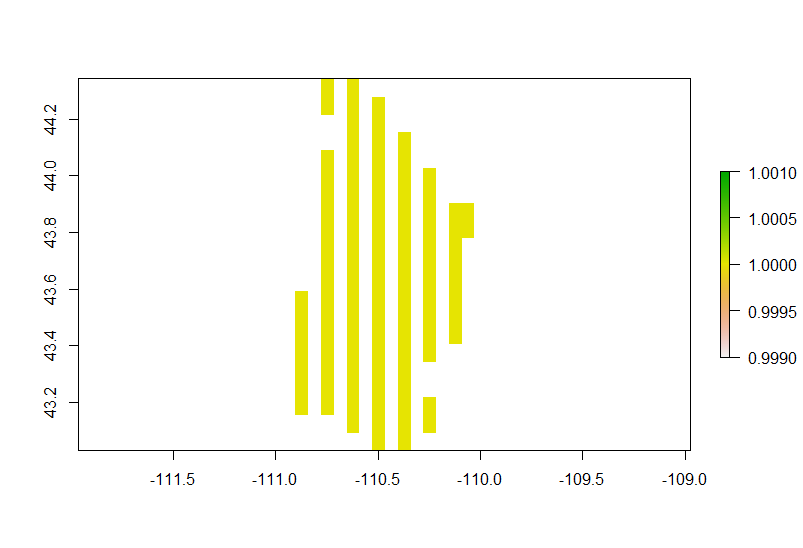
So I tried another method, and the code for this method is:

# CSV to raster
library(raster)
library(sp)
library(rgdal)
library(rgeos)

# sample data
sample <- read.csv("Sample_Data.csv", header=TRUE)
data<-data.frame(sample$X,sample$Y,sample$VIC_SC_04)

# points from scratch 
coords = cbind(sample$X,sample$Y)
sp = SpatialPoints(coords)

# make spatial data frame
spdf = SpatialPointsDataFrame(sp, data)
spdf_pi = SpatialPixelsDataFrame(sp,tolerance = 0.016129, data) # Storing incorrect values in Z basically storing X coordinates in z as well**

    raster = raster(spdf_pi[data$VIC_SC_04]) # gives error Error in which(sapply(from@data, is.factor)) : 
  argument to 'which' is not logical

# back to data
as.data.frame(data)
plot(data)

# Another try
dfr <- rasterFromXYZ(data)  #Convert first two columns as lon-lat and third as value (throws an error)              
plot(dfr)
   
# coerce to SpatialPixelsDataFrame
gridded(spdf_pi) <- TRUE

# coerce to raster
rasterDF <- raster(spdf_pi)
plot(rasterDF)

When I plot 'data', I get:

plot(data)

enter image description here But in the following line, I get the following respective error:

dfr <- rasterFromXYZ(data)
Error in rasterFromXYZ(data) : x cell sizes are not regular

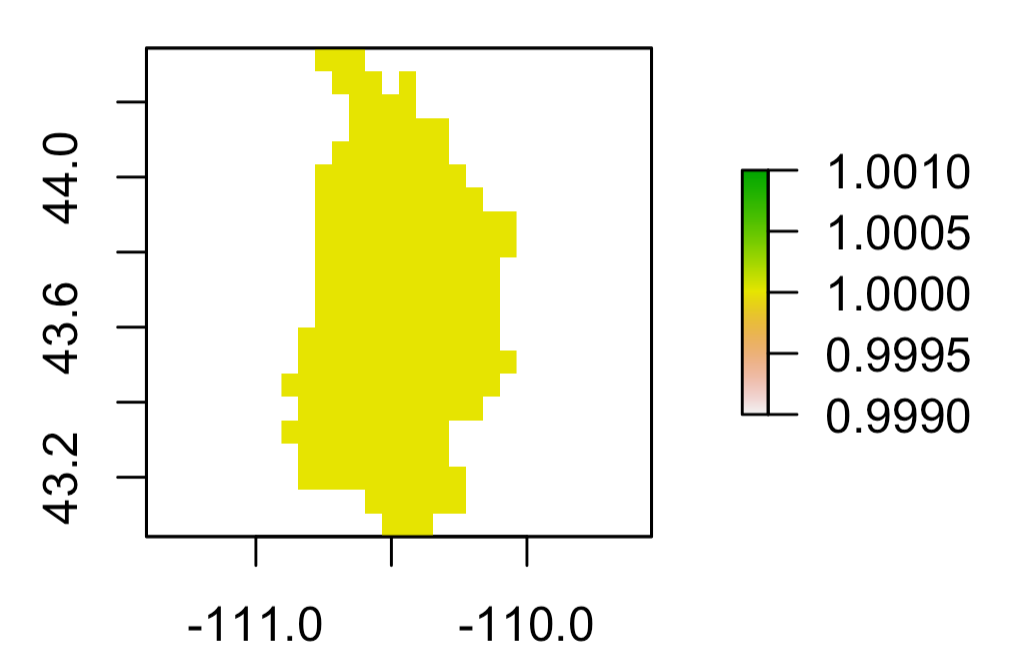
The resultant raster should look like this: enter image description here

1
  • 1
    As to your first example, you have forgotten to put fun=mean inside the rasterize(). You received the second error message because x, y pair has to be on the regular grid when using rasterFromXYZ().
    – Kazuhito
    Commented Jan 13, 2021 at 12:46

2 Answers 2

2

From your code, check number of rows and columns:

library(raster)
sample <- read.csv("Sample_Data.csv", header=TRUE)
x <- raster(xmn=-110.906, xmx=-110.031, ymn=43.03938, ymx=44.3438, res=0.0625, crs="+proj=longlat +datum=WGS84")
x@ncols
# 14
x@nrows
# 21

So, the issue is the number of columns, since you have 15 points horizontally. A solution is:

x <- raster(xmn=-110.906, xmx=-110.031, ymn=43.03938, ymx=44.3438, res=0.0625,ncols=15,nrows=21, crs="+proj=longlat +datum=WGS84")
rstr <- rasterize(points,x,points$VIC_SC_04)
plot(rstr)

enter image description here

This resolves the issue, but keep a weird resolution (0.05833333, 0.06211524 (x, y))

2
  • If you look at the second plot that I posted in my question and compare it with the above plot, the bottom of both plots and some other pixels are not similar. The resultant raster should look like this app.box.com/s/2sopy8nr6rhqj165q7u571pu00uj5u21 Commented Jan 13, 2021 at 22:42
  • 1
    @Arthur_Morgan you're right. I modified the answer. The distance between points isn't the same in all cases horizontally
    – aldo_tapia
    Commented Jan 14, 2021 at 1:25
1

You were sort of on the right track but, were just overcomplicating your code. I should note that, with your example data, there is no variation in the VIC_SC_04 column.

library(sp)
library(raster)

d <- read.csv("sample_data.csv")
  coordinates(d) <- ~X+Y
  
spdf <- SpatialPixelsDataFrame(d, tolerance = 0.016129, d@data)
 r <- raster(spdf, layer=3) 
2
  • Yes, there is no variation because, this particular sample data represents the first two days of the dataset from the month of Feb representing snow cover(SC). And 1 represents 100% snow cover, as the melt season hadn't started yet for that particular year. I might be posting another question regarding creating individual rasters or a daily raster stack for the entire metl season by incorporating the third column (T) for time series. In ArcGIS, I can create a NetCDF from this file and then convert that to daily rasters, but I have yet to try this in R. Commented Jan 14, 2021 at 1:53
  • @ Jeffery Evans, the plot looks good in R (app.box.com/s/n2svtucy3btifw96z4s2vn86ifmzkww4), but when I write the raster to file by using r_WGS84 = writeRaster(r, ~/Sample_raster.tif", overwrite=TRUE), the raster (app.box.com/s/hk1nm0113kwscyk6me0lz1yvamn0a4jk) when viewed in ArcGIS doesn't look similar to the plot in R. Commented Jan 14, 2021 at 3:05

Your Answer

By clicking “Post Your Answer”, you agree to our terms of service and acknowledge you have read our privacy policy.

Not the answer you're looking for? Browse other questions tagged or ask your own question.