I want to plot a raster of the forest cover accross Europe using tmap::tm_raster(). The raster data are available here:
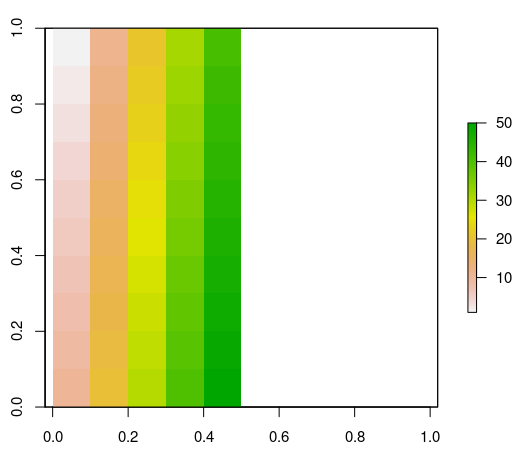
If I plot it, this is what I get:
# Read raster data:
forest <- raster("eea_r_3035_100_m_forest-area-2015_p_2015_v1_r1.tif",      NAvalue = 65535)

# Plot data:
  tm_shape(forest_br) +
    tm_raster(col = "eea_r_3035_100_m_forest-area-2015_p_2015_v1_r1.tif",
              palette = "darkgreen",
              title = "Forest cover")
when I check the raster properties, I see that I have an NA value equal 65535:
> forest
class      : RasterLayer
dimensions : 46000, 65000, 2.99e+09  (nrow, ncol, ncell)
resolution : 100, 100  (x, y)
extent     : 9e+05, 7400000, 9e+05, 5500000  (xmin, xmax, ymin, ymax)
crs        : +proj=laea +lat_0=52 +lon_0=10 +x_0=4321000 +y_0=3210000 +ellps=GRS80 +towgs84=0,0,0,0,0,0,0 +units=m +no_defs
source     : C:/input/eea_r_3035_100_m_forest-area-2015_p_2015_v1_r1.tif
names      : eea_r_3035_100_m_forest.area.2015_p_2015_v1_r1
values     : 0, 65535  (min, max)
My forest = 1, land = 0, and NA should be transparent. If I set NAvalues(forest)<-65535, my min-max values remains the same.
Please, how can I specify this in tmap??? palette seems to works only for continuous data, but what about in my raster is binary and have many NA values (resp. 65535)?
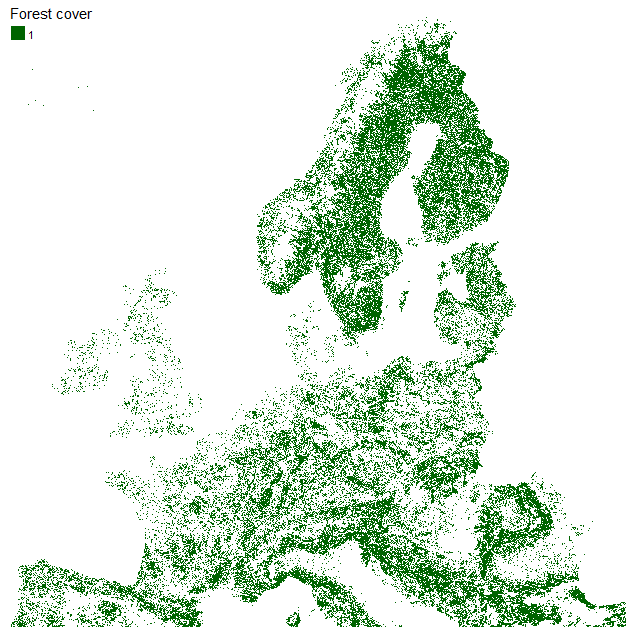
THis is how it should look like (raster reclassified outside of R. Reclassify the values using classical matrix takes forever on my Win 10 64 b, R version 4.0.2 (2020-06-22)).


f[f==65535]=NAbut you've got a huge raster which I dont think is being read into memory. You should probably create a down-sampled version for display.aggregate(forest, fact=3)to downsample it? My original raster is 100 m resolution.