1

I have a code that generates polygons from a MCMC model. For each iteration in the model, I get a polygon of the 95% credible interval for the area. The idea here is that if I generate 10 polygons, I'm able to compute the area for each and then calculate the average area for all polygons.

So,

  1. is it possible to compute the average polygon from all the polygons generated?
  2. Would this "average polygon" be of equivalent size to the average area of all polygons?

Here is the code:

# 1. Packages
library(adehabitatHR)
par(mfrow=c(1,1))

kernel.poly.all = NULL
# 2. Assigning values
set.seed(13456789)
for (potatoe in 1:10) {
  # 3. Empty Dataframe
  points <- data.frame(ID = double())
  XY_cor <- data.frame(X = double(),
                       Y = double())
  
for(i in c(1:100)){
  
  if(i >= 50){points[i, 1] <- 1}
  else {points[i, 1] <- 2}
  XY_cor[i, 1] <- runif(1, 0, 100)
  XY_cor[i, 2] <- runif(1, 0, 100)}

# 4. Transform to SpatialDataframe
coordinates(points) <- XY_cor[, c("X", "Y")]
class(points)

# 5. Domain
x <- seq(-50, 150, by=1.) # resolution is the pixel size you desire 
y <- seq(-50, 150, by=1.)
xy <- expand.grid(x=x,y=y)
coordinates(xy) <- ~x+y
gridded(xy) <- TRUE
class(xy)

# 6. Kernel Density
locs = SpatialPoints(points)
kud_points <- kernelUD(locs, h = "href", grid = xy)
# image(kud_points)

kernel.ref <- kernelUD(xy = locs,
                       # grid = xy  ,
                       grid = 250,
                       extent = 10,
                       # same4all = TRUE,
                       h = "href")
area.save = kernel.area(x = kernel.ref, 
                           unin = 'm', unout='m2',
                           percent = 95)

kernel.poly <- getverticeshr(kernel.ref, 
                             percent = 95,
                             unin = 'm', unout='m2') 
kernel.poly.all = c(kernel.poly.all,kernel.poly)
if(potatoe==1){
  plot(kernel.poly,
       border = "black", 
       lwd=1,
       axes = TRUE,
       xlim = range(x),
       ylim = range(y))
}
if(potatoe>1){
  plot(kernel.poly, 
       border = "black",
       lwd=1,
       add = TRUE)
}
print(potatoe)
}

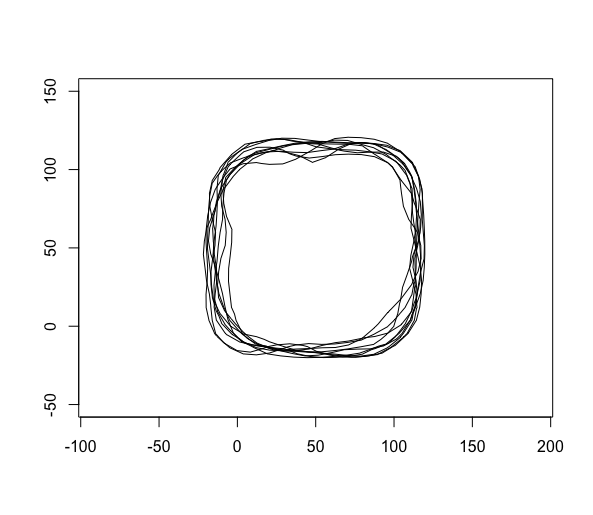
The object kernel.poly.all contains the 10 iterations of loop, so a total of 10 polygons.

enter image description here

The code above was derived from this question and adapted to make a reproducible example.

2
  • I don't see an MCMC in that code - is that a separate thing and this code is just generating polygons similarly to your MCMC code?
    – Spacedman
    Commented Feb 20, 2021 at 8:42
  • What's the "average polygon" of two perfectly overlapping circles? Its the same circle, right? But shift the circles apart. What does the "average polygon" look like then? What about two circles that only touch, or two separate circles? Defining an "average polygon" is not simple, and there's no clear unique answer unless you can more clearly define the terms of your polygon distribution...
    – Spacedman
    Commented Feb 20, 2021 at 8:48

2 Answers 2

1

Michael Dorman's answer looks quite similar to this PostGIS question, which was answered in more detail at this blog post. R's sf and PostGIS are similar in that they both build on the GEOS library, but don't have quite the same set of functions.

Unfortunately I don't think the n.overlaps column in the result of sf::st_intersection() is counting what was expected in this instance. Given the inputs, the output polygon should not have that jagged shape or any interior holes.

I think the closest R/sf version of that answer is more like:

library(sf)
library(dplyr)

kpa_sf <- lapply(kernel.poly.all, function(i) st_as_sf(i))
kpa_sf <- do.call('rbind', kpa_sf)

kpa_small_polys <- kpa_sf %>% 
  # randomly generated data is messy, snap to grid helps reduce intersection problems
  st_snap_to_grid(0.01, c(0,0)) %>% 
  st_intersection() %>% 
  # some results are lines, discard those:
  st_collection_extract('POLYGON') %>% 
  # some results are multipolygons, split them up:
  st_cast('MULTIPOLYGON') %>% 
  st_cast('POLYGON') %>% 
  st_make_valid()

# conservative approach to determining overlaps helps account for messy geoms
# "how many big polygons are under a random point inside the small polygon"
kpa_small_polys$n_overlap <- 
  lengths(st_within(st_point_on_surface(kpa_small_polys), kpa_sf))  

# keep segments with n_overlap > 5
kpa_merge <- dplyr::filter(kpa_small_polys, n_overlap > 5) %>% 
  st_union() %>% 
  st_make_valid()

# still some wierd little slivers left, but this is to do with the
# inputs, not the method
kpa_merge_outline <- kpa_merge[[1]][[1]] %>% list() %>% st_polygon()
  

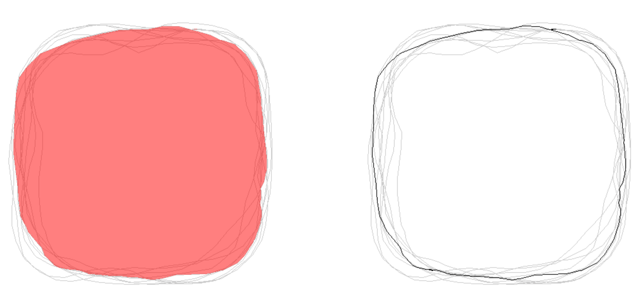
The final output shape still looks a bit messy up close, even if its technically valid.

enter image description here

I don't think there's any reason to expect the 'average' polygon's area to match the average area of the input polygons, as calculated by this method. The more convoluted their borders are and the less they overlap, the bigger difference you're likely to see.

1

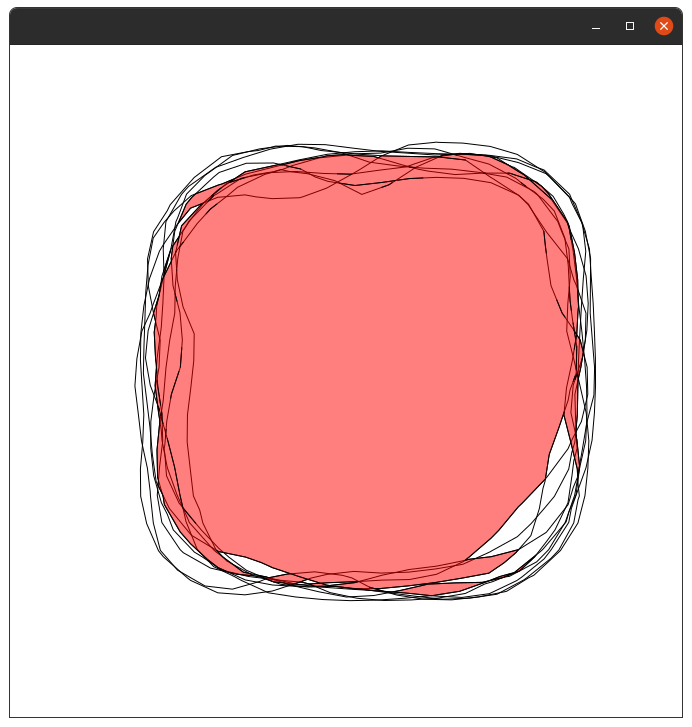
One way to define an "average polygon" could be the area covered by at least 50% of simulated polygons. Here is how this can be calculated using sf:

library(sf)

# Combine
pol = kernel.poly.all
pol = do.call(rbind, pol)
pol = st_as_sf(pol)

# Calculate average polygon
pol_avg = st_intersection(pol)
pol_avg = pol_avg[pol_avg$n.overlaps >= nrow(pol)/2, ]
pol_avg = st_union(pol_avg)

# Plot
plot(st_geometry(pol))
plot(st_geometry(pol_avg), col = "#FF000080", add = TRUE)

Resulting plot, with average polygon in red:

enter image description here

Your Answer

By clicking “Post Your Answer”, you agree to our terms of service and acknowledge you have read our privacy policy.

Not the answer you're looking for? Browse other questions tagged or ask your own question.