2

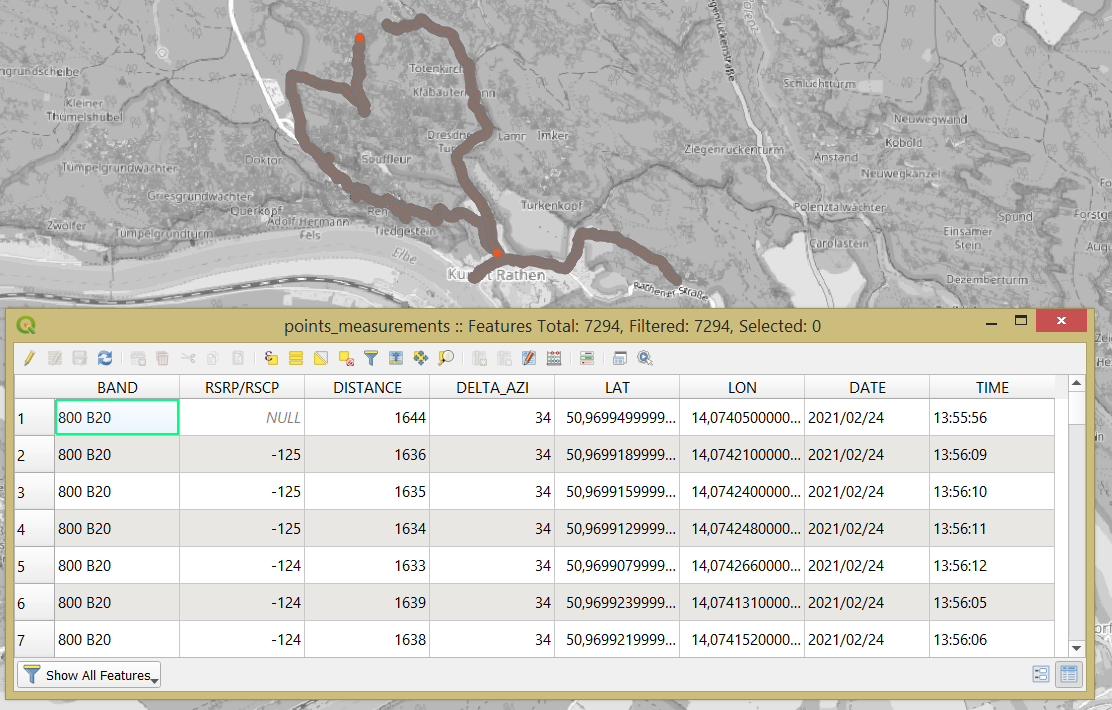
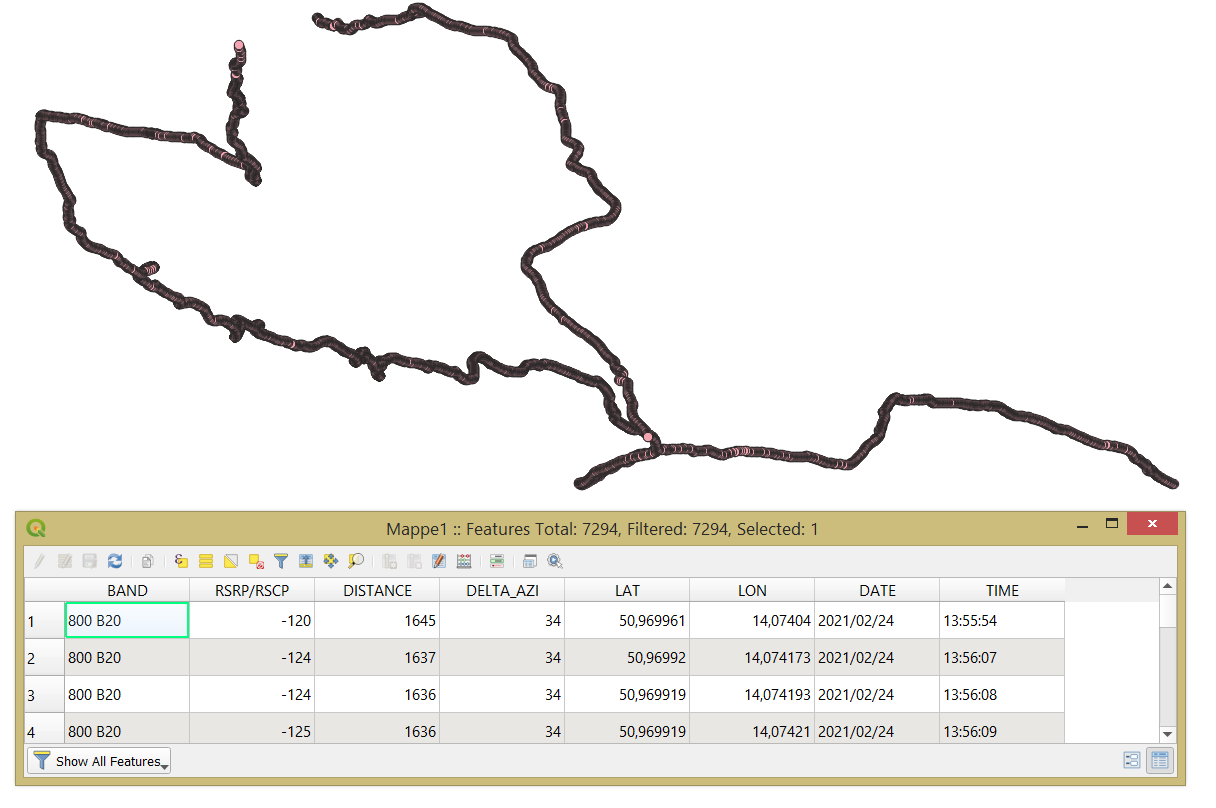
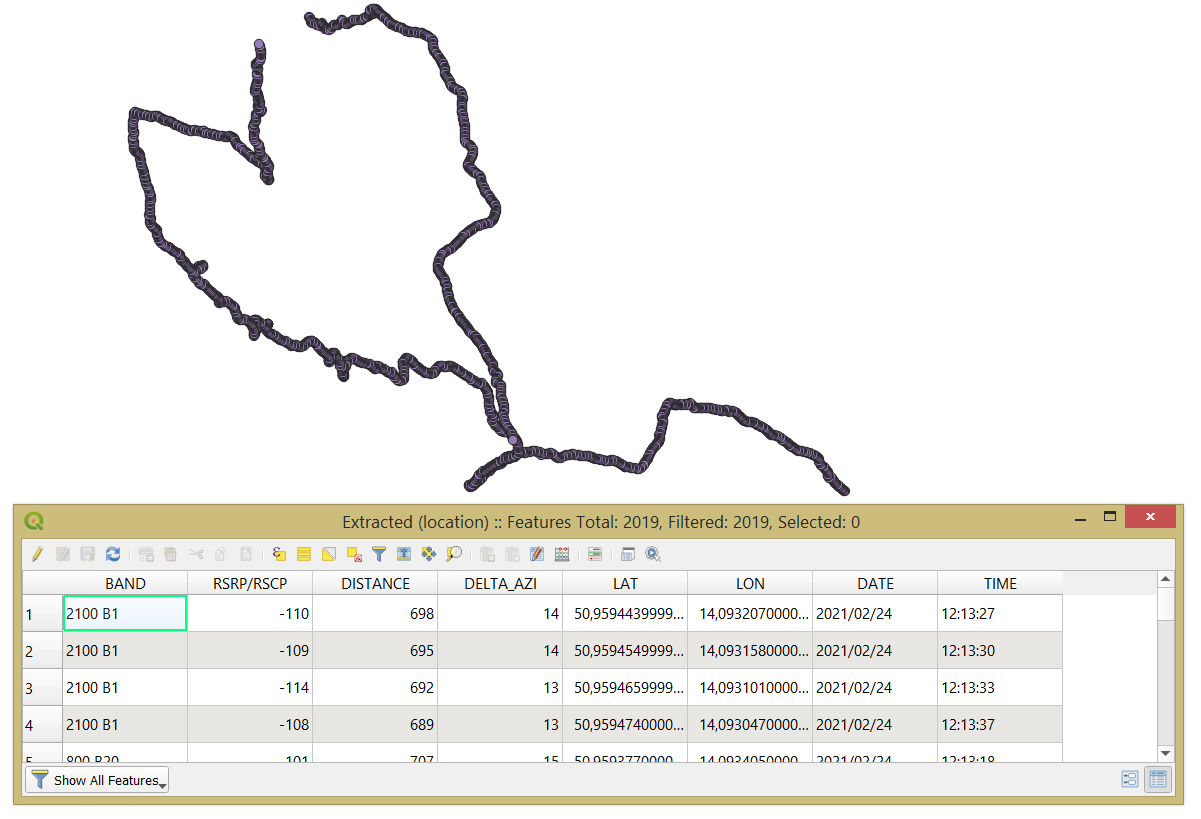
I have huge CSV files from measurements (most of them are done by car), like this:

measurement file

The measurement system record one value every second and save this together with the GPS coordinates. That's why there are a lot of measure points very close together (e.g. because of waiting at traffic lights or a part of the streets are run and measured multiple times. In the end, the file is bigger than necessary.

Now I'm looking for a solution to reduce the measurement points. At the end of the day, I want to have a measured value displayed on the map only every 5 meters if the measured positions ​​were closer than 5 meters. If the measured values ​​were further apart, then of course these are the way they are.

If the points are closer together than 5 meters, the new center point coordinate should contain the values ​​of the measured value that contains the maximum value of the RSRP column within these 5 meters. Most important is for me, to have the maximum value of RSRP in a 5m radius at the end.

If the assigning of a new 5m center coordinate cannot be easily done with QGIS tools, it would also be sufficient for me if the points with the maximum value of RSRP are displayed within 5m at their original position = the points do not have a fixed 5m distance, but between 0m and 10m distance.

While the simplification, the points should not be summarized with their chronologically adjacent points only, but with all in 5m radius (those that were recorded at a later point in time by repeatedly measuring the same route section)

With a solution from @Taras, I could remove a lot of intermediate positions and make the file smaller. However, this solution has the following disadvantages for me and I am looking for a solution that also solves this:

  1. With 'Extract by location', the point value of the base point of the simplified path is adopted (regardless of the RSRP value). But I absolutely need the maximum value of RSRP in a 5m radius.
  2. The resulting points are at the end not with a fixed 5m distance. This means that if the path is straight for a long time before the simplification, the path will not have any support points over long distances after the simplification to which the original measuring points would be mapped in the next step. So I lose the information which measured values ​​the points (5m apart from each other) have on the way in between. If this cannot be easily solved with QGIS tools, it would also be sufficient for me if the points with the maximum value of RSRP are displayed within 5m at their original position = the points at the end do not have a fixed 5m distance, but between 0m and 10m distance.
  3. In the simplification, the points are only summarized with their chronologically adjacent points, but not also with those that were recorded at a later point in time by repeatedly measuring the same route section (cf. in Rathen the route between the ferry and the intersection)
8
  • 1
    Peter, can you please share this csv file with us here (or a sample of it)?
    – Taras
    Commented Mar 5, 2021 at 18:16
  • Tara, did you see linked the screenshot already?
    – Peter
    Commented Mar 5, 2021 at 18:41
  • 4
    Yes, I am just a bit lazy to type those values 😅
    – Taras
    Commented Mar 5, 2021 at 18:43
  • I like to do that, but I can't find a way to upload a csv file here !?
    – Peter
    Commented Mar 5, 2021 at 19:06
  • 2
    you can paste in a few lines of the csv file (for those of us too lazy or paranoid to download random files from the internet)
    – Ian Turton
    Commented Mar 6, 2021 at 9:11

2 Answers 2

4

Happy - I figured it out myself!

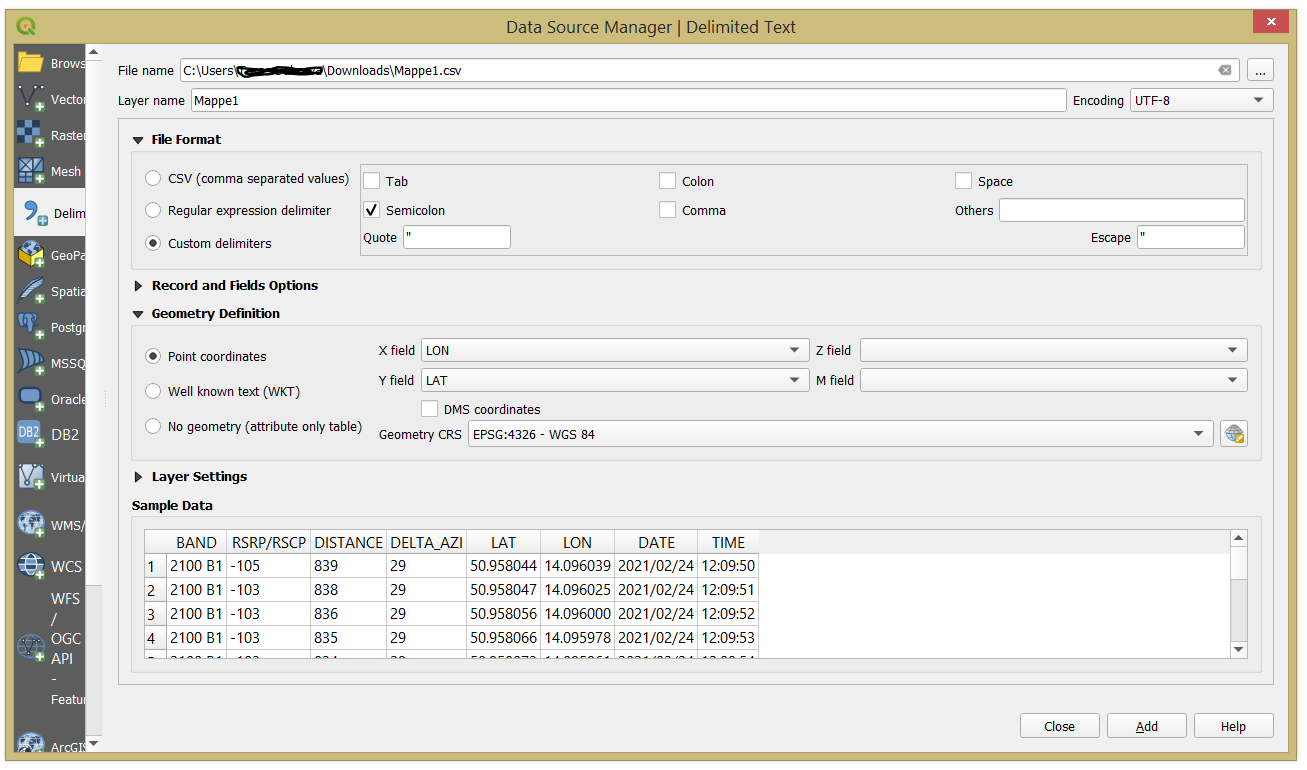
Step 1. Import a CSV-file with your data via 'Layer > Add Layer > Add Delimited Text Layer' (as shown in answer 1 from @Taras)

csv_input

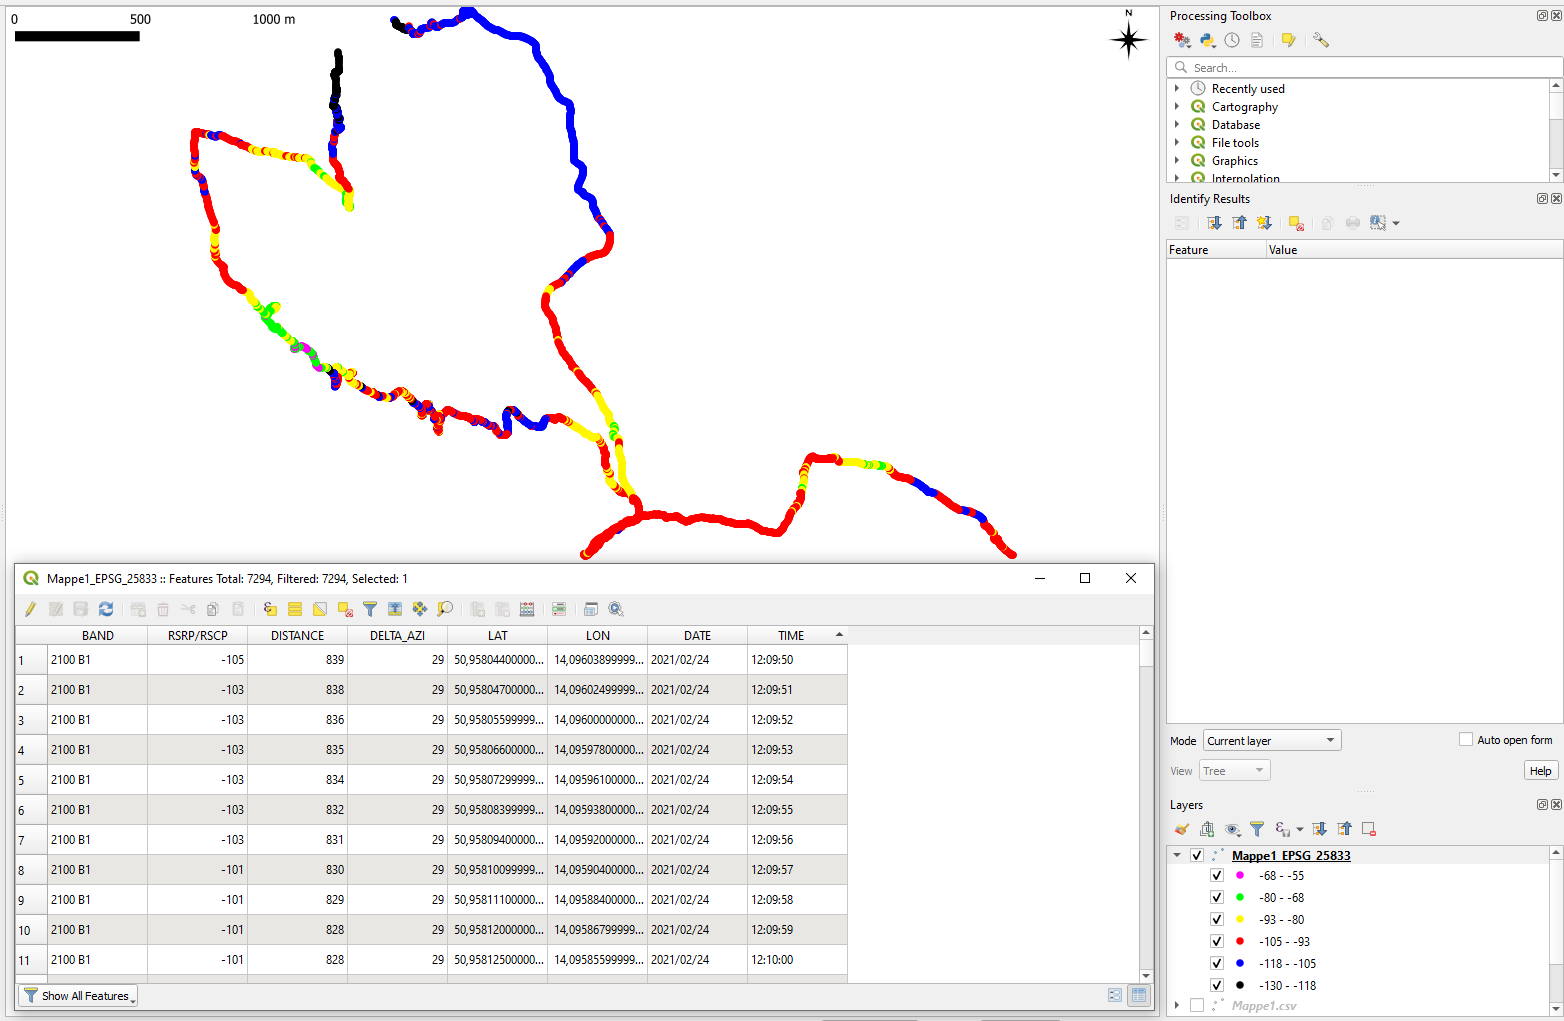
Step 2. Save your temporal point layer as e.g. a shapefile with a corresponding CRS. Here I will choose the EPSG:25833, hence you will need meters later. (as shown in answer 1 from @Taras)

point_layer_shp

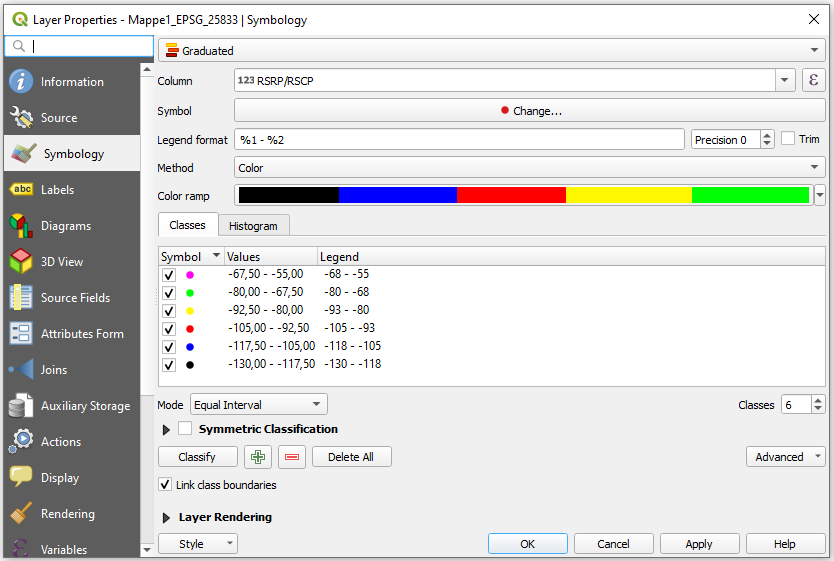
Step 3. Give them a suitable symbology (only necessary for a better visual check of the next steps)

Symbology_example

Snapped_Points

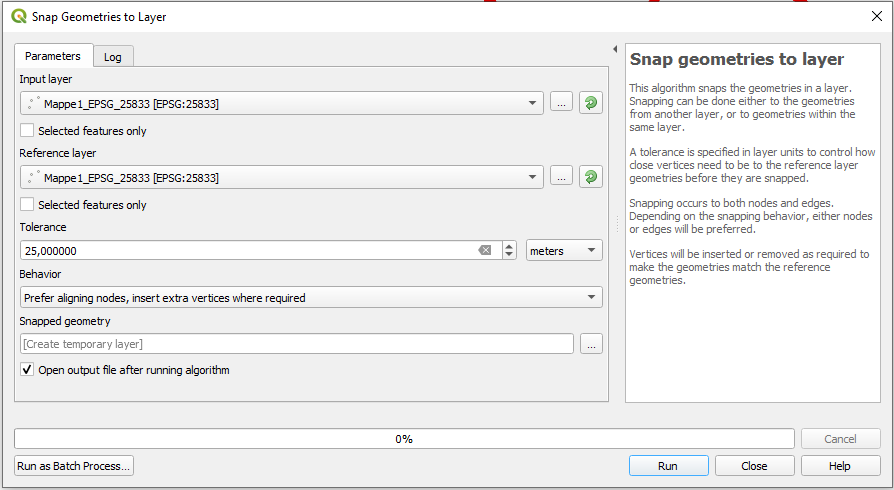
Step 4. Use the "Snap Geometries to Layer" via Toolbox. Input layer and Reference layer are set to output layer from step 2. Set the value for tolerance to your desired value for the point spacing.

Snap_Dialogbox

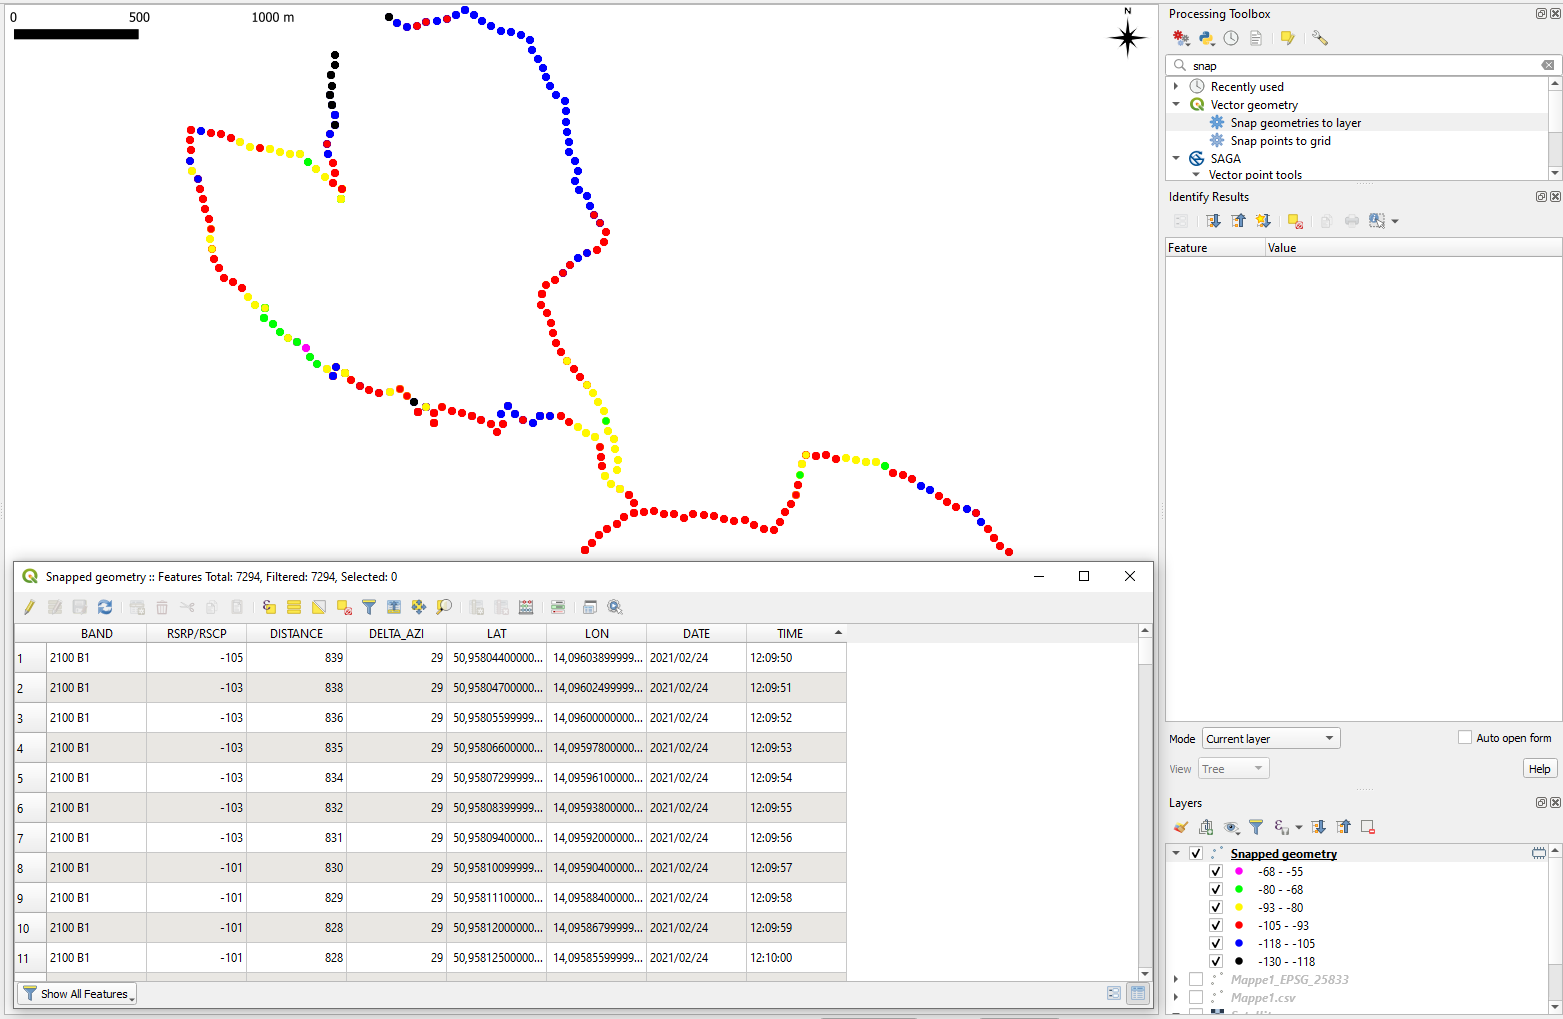
If desired, give them the same suitable symbology (copy style & paste style by right clicking on Layer names and selecting "Styles")

Snaping_result

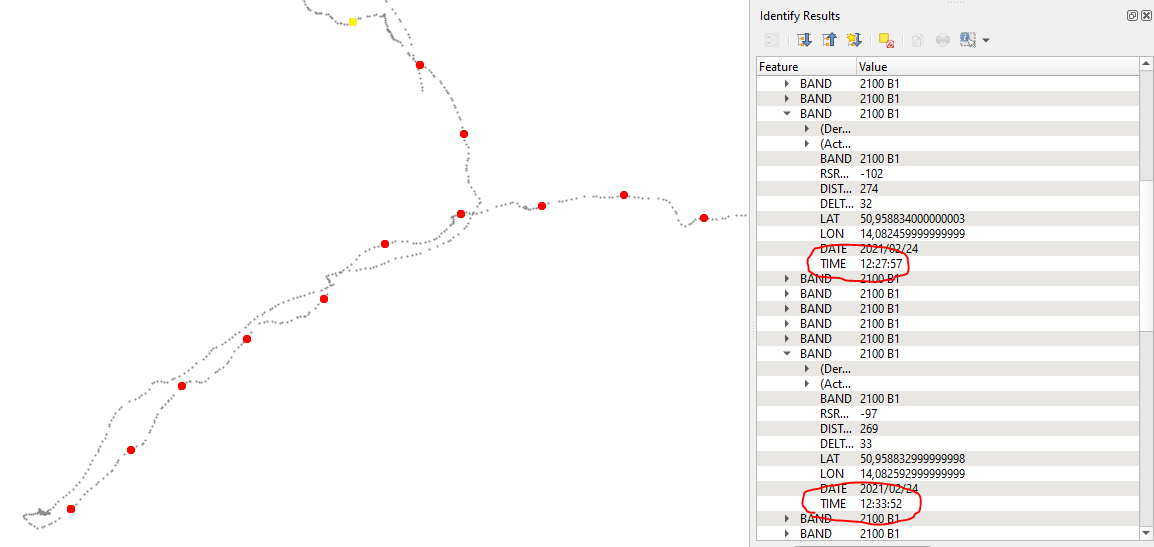
Here a closer look on the result (the small grey dots are the original CSV layer for comparison)

Snaping_result_zoomed

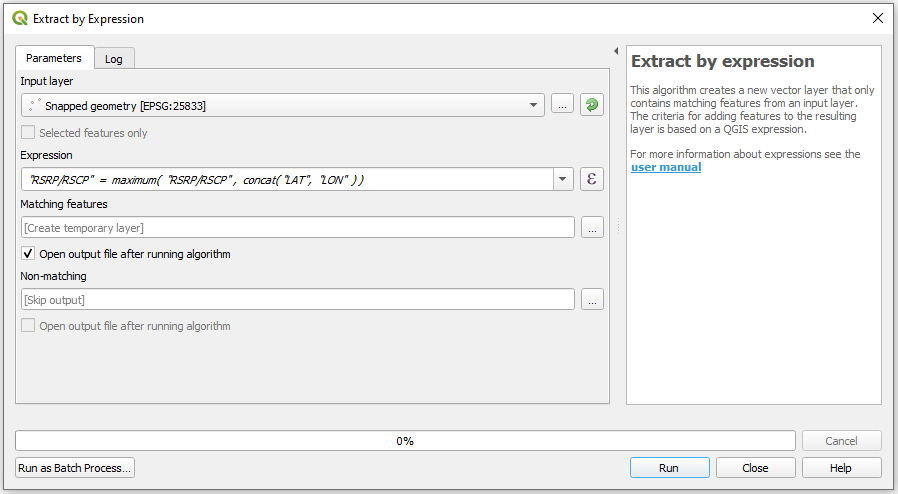
Step 5. To extract the values ​​with the largest value from RSRP use the "Extract by expression" via Toolbox. Input layer set to output layer from step 4. As Expression use

"RSRP/RSCP"  =  maximum(  "RSRP/RSCP" ,  $x  ||  $y  ) 

Extract_by_expression_dialogbox

The result layer now contains all values ​​with the maximum value for RSRP per coordinate. If there are several values ​​with the maximum value for RSRP, there are still several values ​​per coordinate (but all with the same value for RSRP).

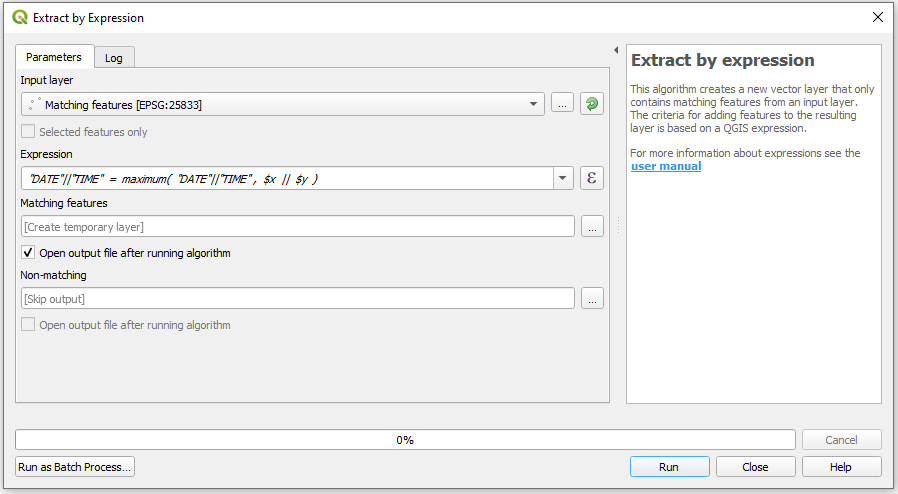
Step 6. Since I really only want one value per coordinate, I extract the one with the most recent date by using the "Extract by expression" for the second time. Input layer set to output layer from step 5. As Expression use

 "DATE"||"TIME"  =  maximum(  "DATE"||"TIME" ,  $x  ||  $y  )

enter image description here

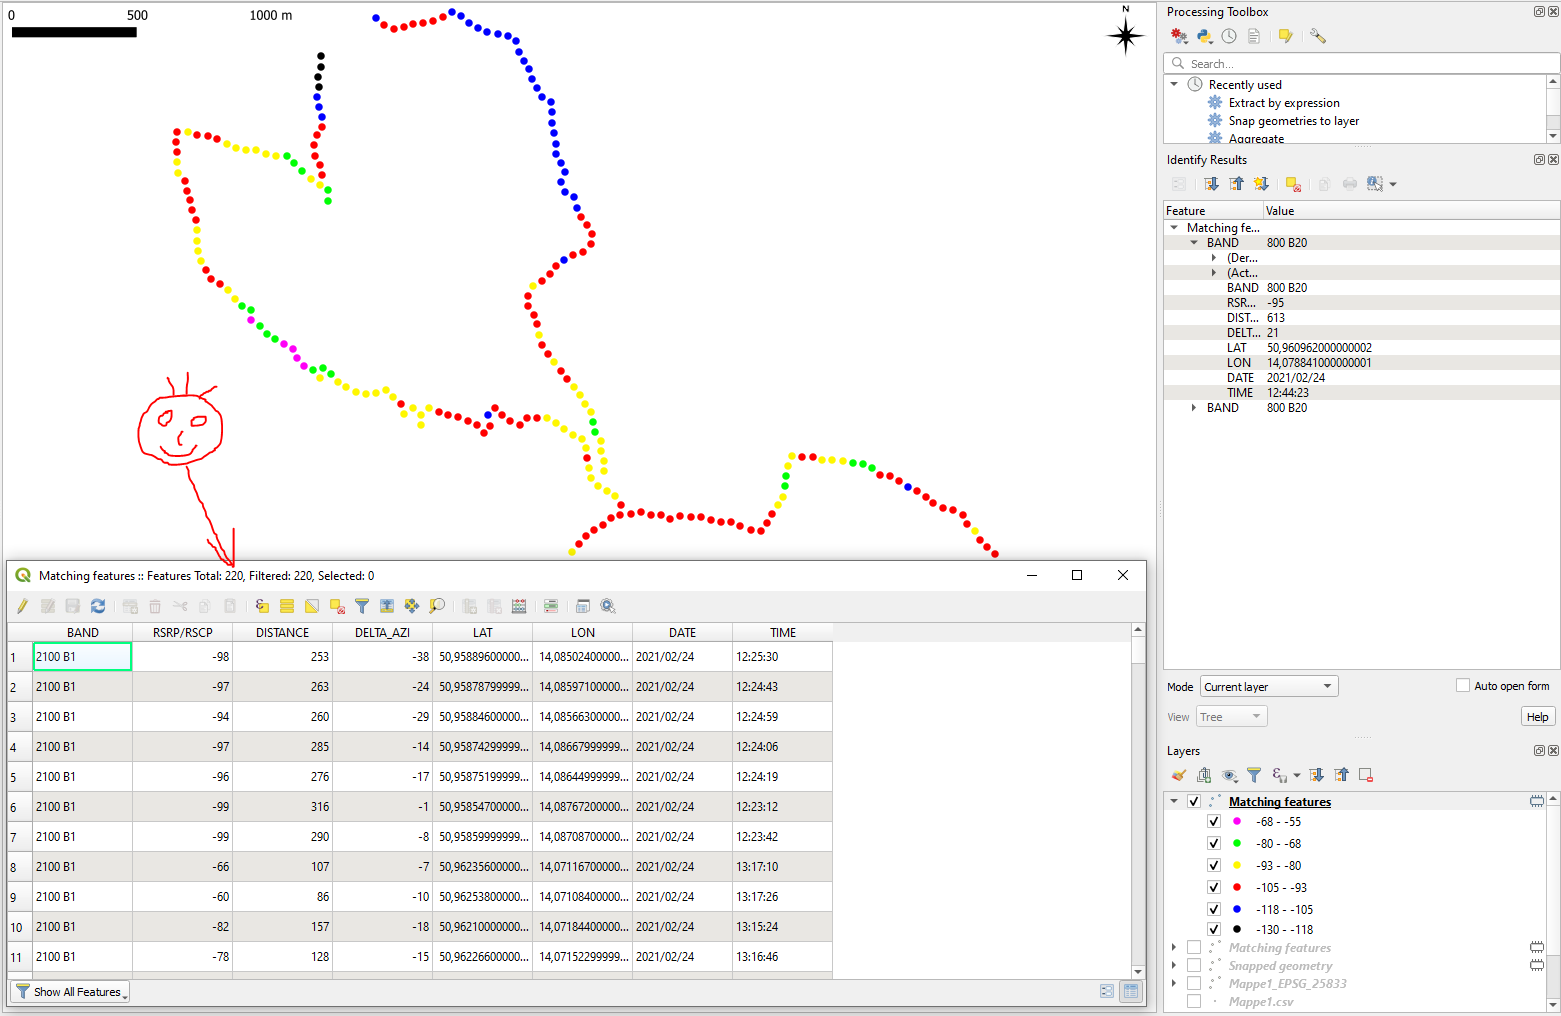
The result layer now contains only one value ​​per coordinate. If desired, give them the same suitable symbology (copy style & paste style by right clicking on Layer names and selecting "Styles").

enter image description here

THE END :-)

1

Step 1. Import a CSV-file with your data via 'Layer > Add Layer > Add Delimited Text Layer'.

csv_input

point_in_qgis

Step 2. Save your temporal point layer as e.g. a shapefile with a corresponding CRS (I will choose the EPSG:25833, hence you will need meters later).

point_layer_shp

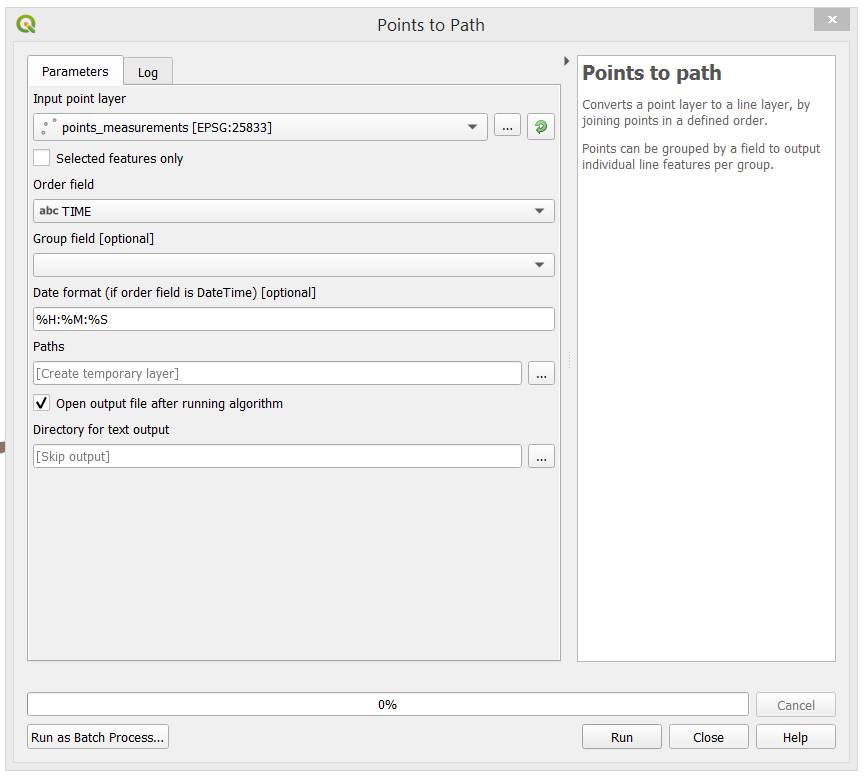
Step 3. Convert points to a path using the "Points to Path" geoalgorithm. I used the time "TIME" attribute, otherwise you will need to concatanate "DATE" and "TIME" and use this %Y/%m/%d %H:%M:%S as 'Date format'.

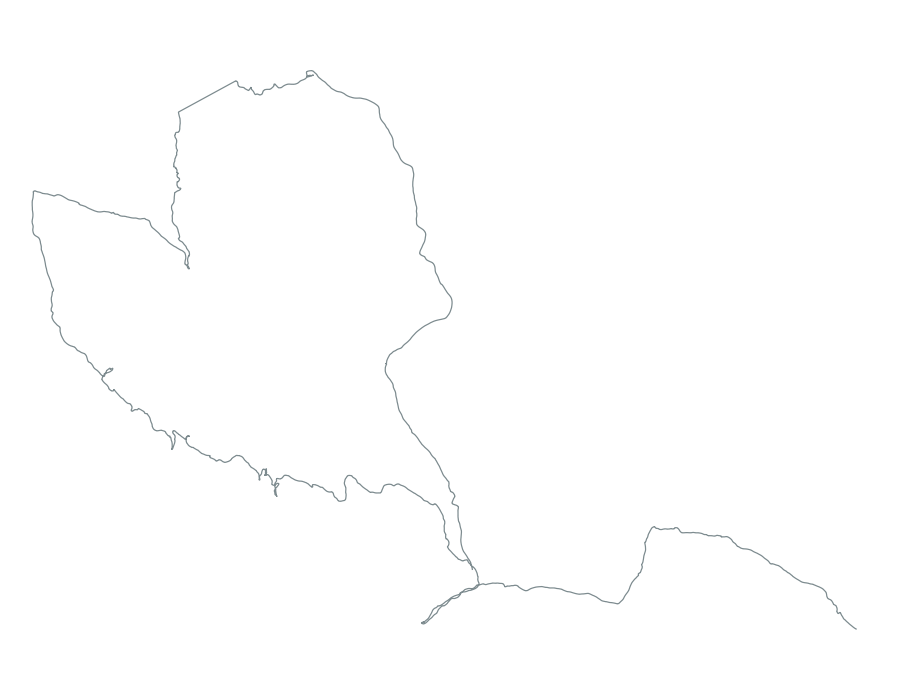
path1

path2

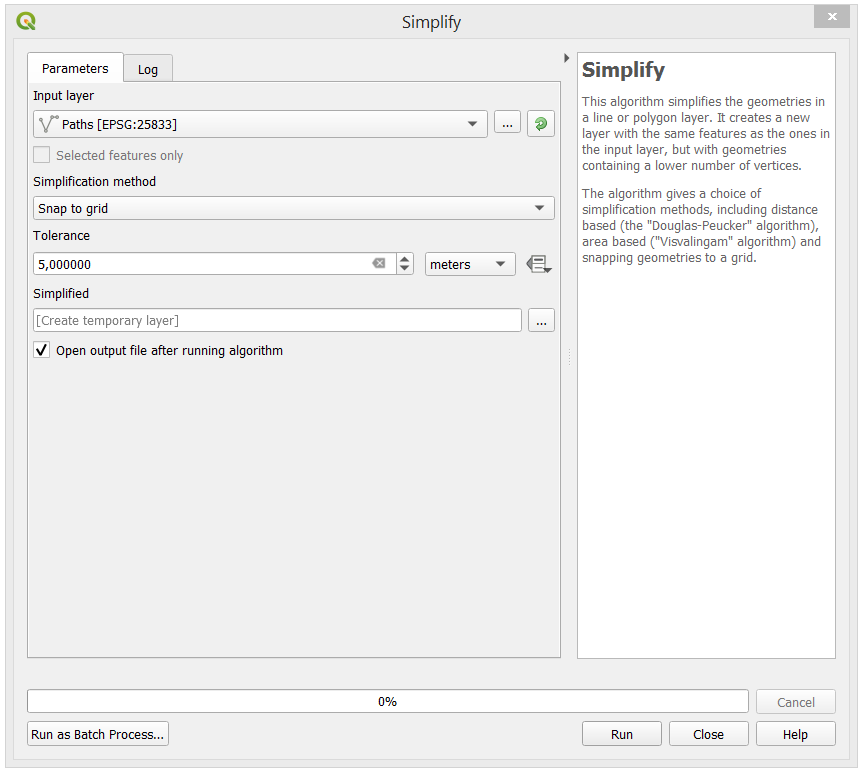
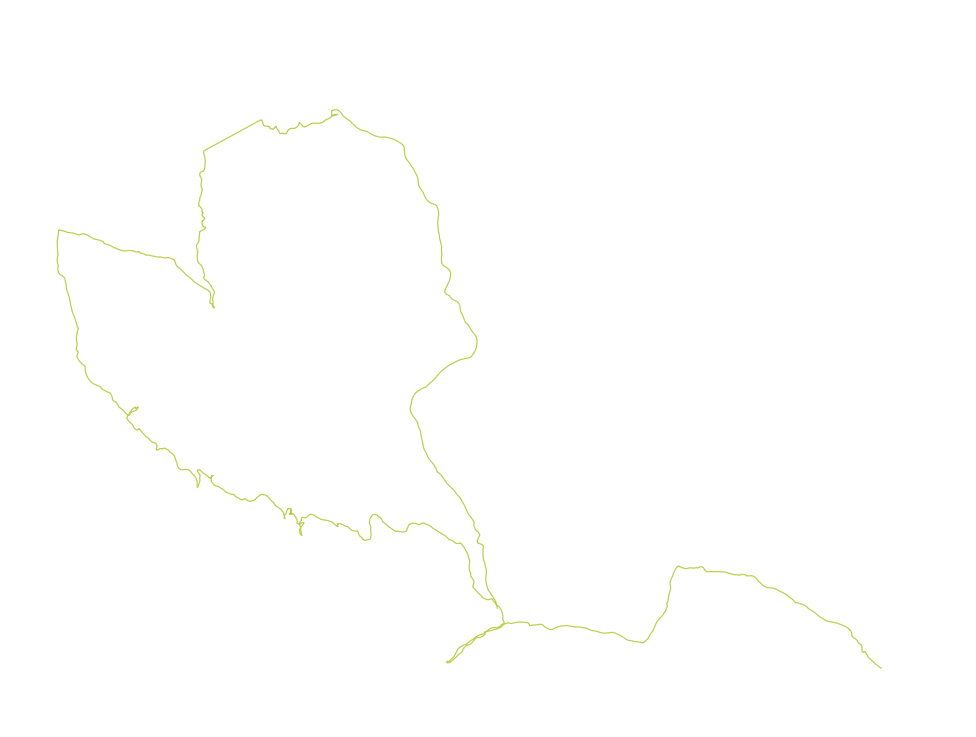
Step 4. Simplify your line geometry via the "Simplify" tool. Perhaps using a "Smooth" algorithm is somehow better.

simplification1

simplification2

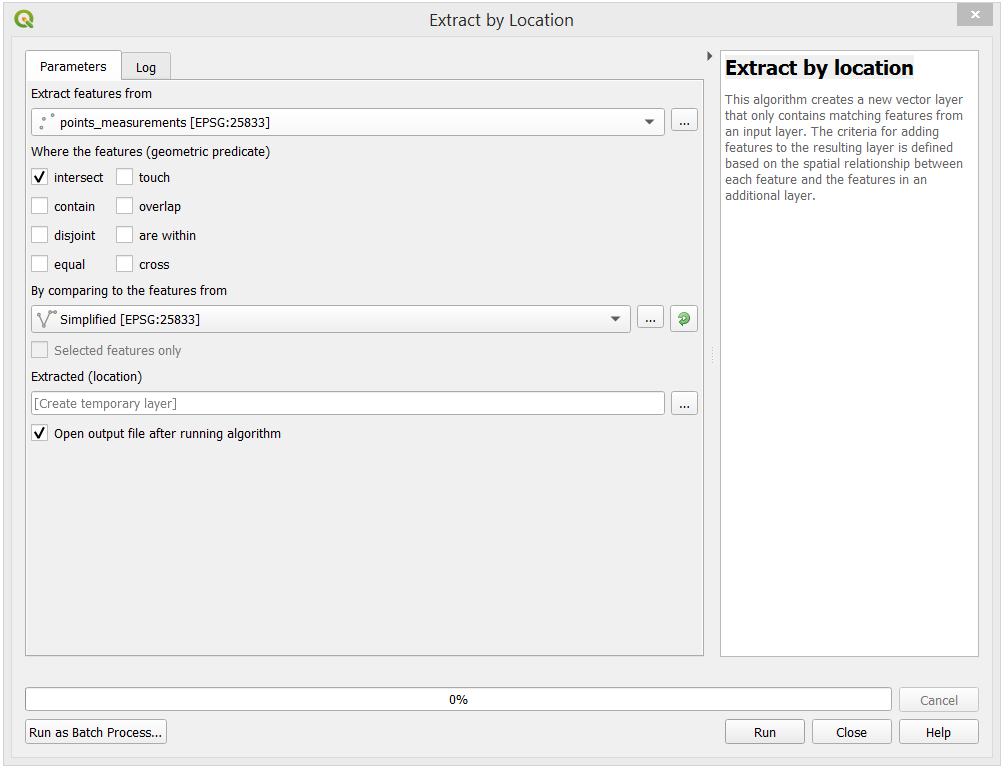
Step 5. And finally apply the "Extract by location" and get the output.

result1

result2

P.S. I would doubt that (all) these measurements were acquired using a car. I know this area well =)

1
  • 1
    Thank you very much, Taras. But I am looking for a maximum of RSRP every 5 meters.
    – Peter
    Commented Mar 7, 2021 at 15:49

Your Answer

By clicking “Post Your Answer”, you agree to our terms of service and acknowledge you have read our privacy policy.

Not the answer you're looking for? Browse other questions tagged or ask your own question.