0

I want to create a buffer for a line raster by filling the NA values orthogonally to each cell.

sample data

library(raster)
r <- raster(resolution=5)
values(r) <- 1:ncell(r)
cds <- rbind(c(-160,-20), c(-140,55), c(10, 0), c(140,60))
line <- spLines(cds)
r <- mask(r, line)

Now what I want is to create a buffer zone for r with, say 25m on each side with the orthogonal NA cells are filled with the cell value. I know some cells might have an overlap of two or more orthogonal. I would like to use the average value at such instances. How do I do this? I tried with raster::buffer(r, width = 25) and created the binary raster, but I don't know what to do next.

1
  • Can you please edit your question to make clear what you mean with orthogonal (to what?); Can you show what you would want the output to be for a few cells in the example data? Also please provide a link to the original question and there is a partial answer there (and vice versa, link that question to this one). Commented Jun 29, 2021 at 20:42

2 Answers 2

2

I think this does most of what you want, except perhaps the averaging bit. It uses the fact that the nearest point on the raster line to any other grid point will be the orthogonal distance to the line.

First get all the non-NA locations as an x,y,value matrix:

rp = rasterToPoints(r)

Then construct the buffer area. The r raster is lat-long so you need to buffer it in a huge number of metres to get something usable. Your coordinate system may vary (and I couldn't find a way to make raster::buffer use degrees. Anyway...)

buf = raster::buffer(r, width=1600000)
plot(buf)

Then get the x,y,value of all the non-zero buffer points. The values will all be 1

bp = rasterToPoints(buf)

Now use the FNN package (installable from CRAN) to get the nearest (k=1) neighbour of each buffer point to the points on the line:

library(FNN)
nn = knnx.index(data=rp[,1:2], query=bp[,1:2],k=1)

That gives us a matrix with one column, which has the index of the point in rp that is nearest to each point in bp.

Make a copy of the buffer raster for output. You can use buf if you don't need it anymore:

nr = buf

Now replace the 1 values in nr with values in the source raster points by looking up the value in the source raster points (column 3) in the matching rows:

values(nr)[!is.na(nr[])] = rp[nn[,1],3]
plot(nr)
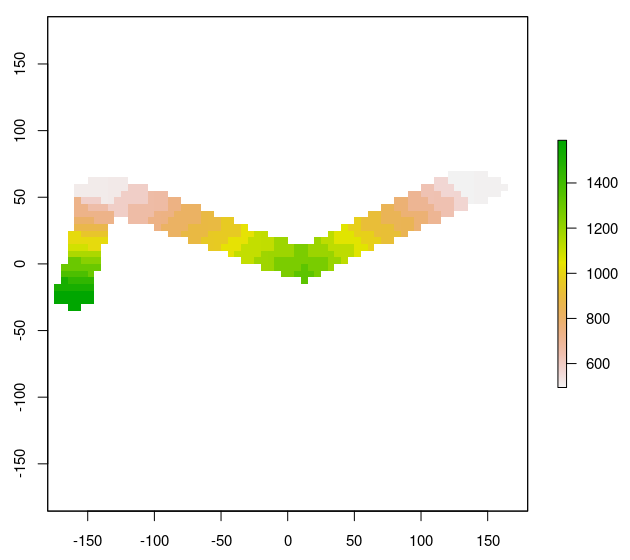
enter image description here

Which I think is, apart from this "averaging" bit, what you are after. I'd test it with a few more lines (particularly try a vertical and horizontal one) to see what you get.

1
  • An elegant and straightforward solution. I see KNN also has get.knnx which also outputs the distances. Thanks for pointing me to the right library. I am trying to find out what happens in cases where there are two cells with equal shortest distances. Can't seem to find anything from the help.
    – rm167
    Commented Jun 30, 2021 at 17:27
1

Spacedman's solution is so nice that you may want to see it twice (but now with terra)

library(terra)
rr <- rast(resolution=5)
values(rr) <- 1:ncell(rr)
cds <- rbind(c(-160,-20), c(-140,55), c(10, 0), c(140,60))
lin <- vect(cds, "lines")
rr <- mask(rr, lin)

rp <- as.points(rr)

bf <- buffer(rr, width=1600000)
bf <- ifel(bf, 1, NA)
bf <- mask(bf, rr, inverse=TRUE)
bp <- as.points(bf)

# nearest points (cells) on line and values
n <- nearest(bp, rp)
v <- extract(rr, rp)

# assign back to the raster
cell <- cellFromXY(rr, cbind(n$from_x, n$from_y))
rr[cell] <- v[n$to_id,2]
plot(rr)

Your Answer

By clicking “Post Your Answer”, you agree to our terms of service and acknowledge you have read our privacy policy.

Not the answer you're looking for? Browse other questions tagged or ask your own question.