9

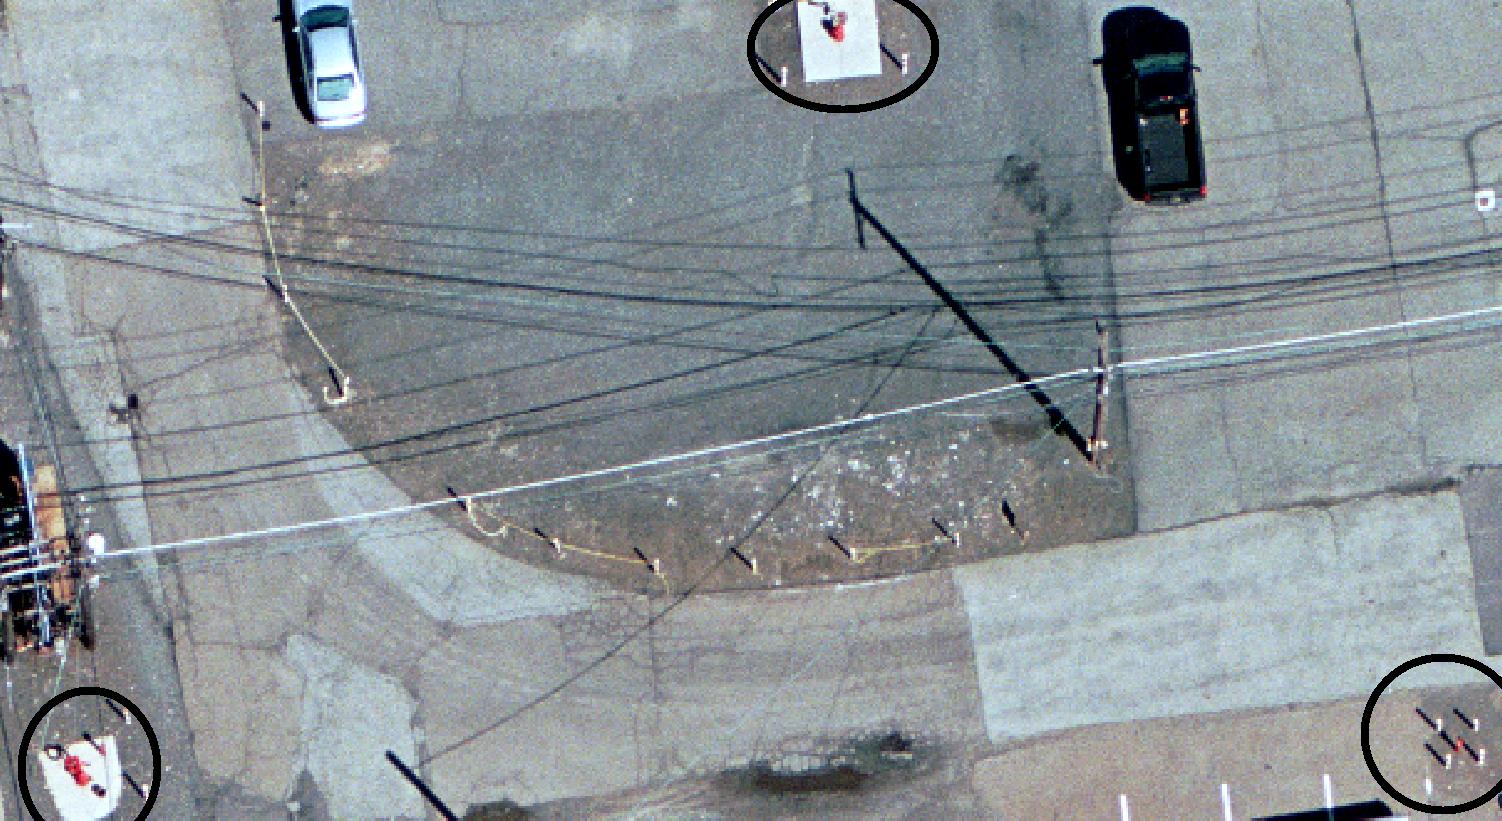
I've got some aerial photography (format: IMAGINE Image) which is detailed enough to see to fire hydrants and a shapefile of fire hydrants which was digitized based on some CAD data. My project is to QC the fire hydrant shapefile locations by spot checking with the imagery. Is it possible to extract RGB values from the imagery that match the fire hydrants RGB values?

Fire hydrant (red):
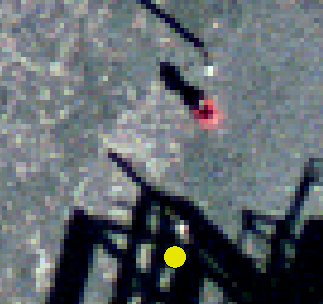
Fire hydrant

I'm looking to select cell values (which i have written down) that are similar to the cell values of the fire hydrant and then extract those cells (either a raster file of those cells or a shapefile which plots location of similar cells). I'm assuming that there are very few features in the imagery that have similar reddish RGB Values.

After looking at Arron's Answer and playing around with both the supervised and unsupervised approach (see my comment below), i was unable to get the tool to perform exactly what i wanted until I started too look at the confidence raster output from the Maximum Likelihood Classification tool. I am not to sure what exactly the raster output is supposed to symbolize but from just looking at the level 14 cell value, but it captured the all the fire hydrants.

raster output: raster output location of fire hydrants: location of fire hydrants
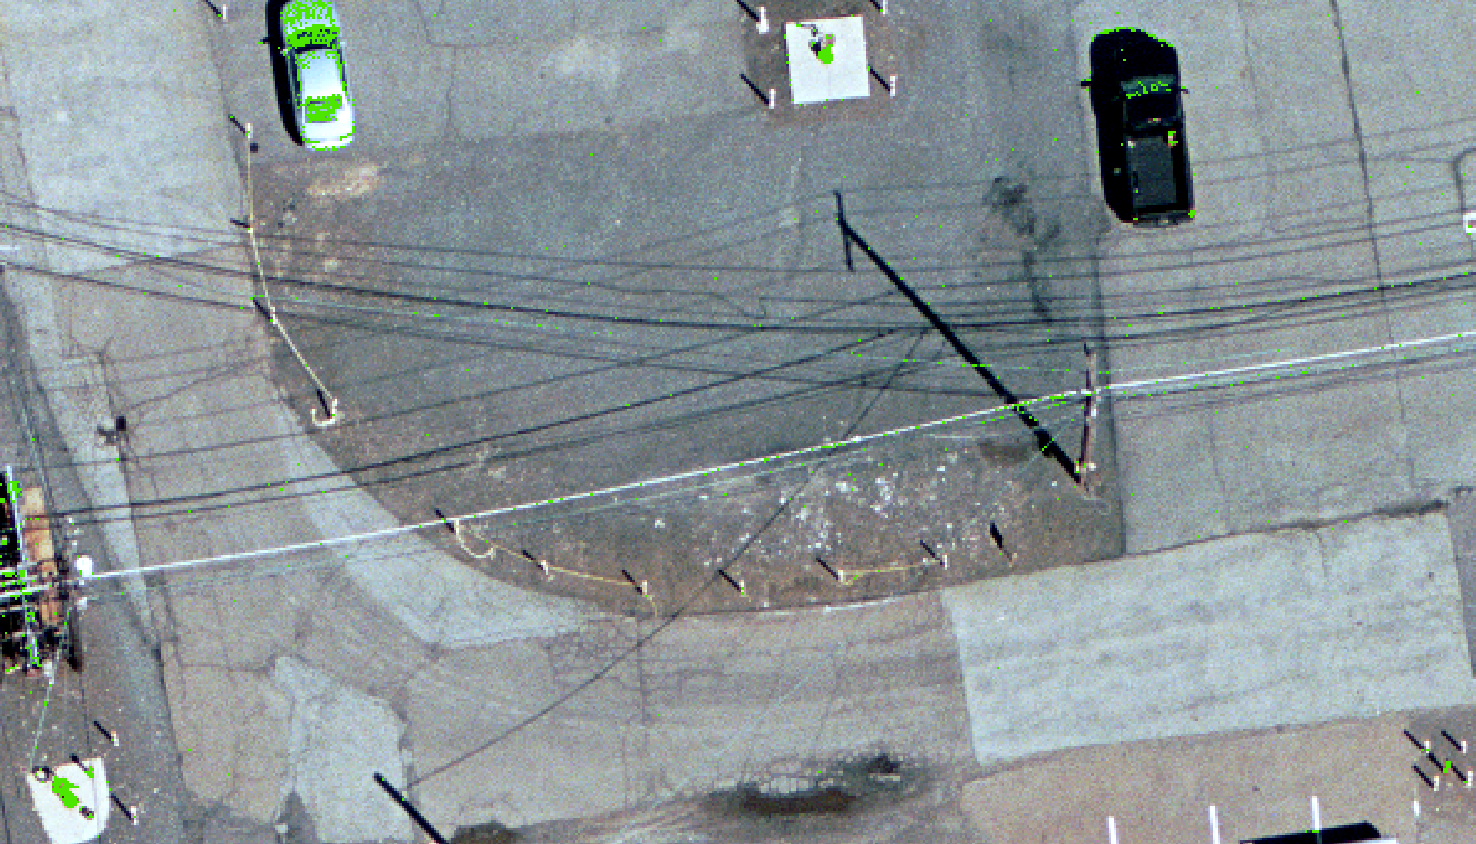
My next step is to use the tool Raster to Polygon convert the fire hydrant raster footprint to a polygon. I am running the tool right now and in the past hour it has only made it to 11%. The area I am working in is large, at 1x1 mile so I understand that it could take some time if there is a lot of small raster cells to convert to a polygon. Are there any suggestions on running some tools to clean up some of the data so it speeds up the process of converting the raster to a polygon? I may not have a need to run this tool this since the raster footprint did such a good job at capturing the fire hydrants but I am interested in speeding up the process since I foresee this being used in other applications for the future.

8
  • Do you mean an extraction like the Extract Values to Points tool in Spatial Analyst? Or do you want more functionality?
    – Baltok
    Commented Nov 13, 2012 at 20:19
  • 1
    I was looking for more functionality than that. That tool appends the values of the imagery to the point it falls under. To get a visual idea, I uploaded an image to dropbox: [Link] (dropbox.com/s/z0fyc9euy99chw1/FireHydrant.png) I guess I should of been a bit clearer. I'm looking to select cell values (which i have written down) that are similar to the cell values of the fire hydrant and then extract those cells (either a raster file of those cells or a shapefile which plots location of similar cells). Let me know if you need me to clear anything else up.
    – Sethdd
    Commented Nov 13, 2012 at 20:47
  • So, you are assuming that fire hydrants in the imagery use unique RGB values that no other feature uses? I.e., there are no other features in the imagery that are reddish? In that case, you might be able to use Extract By Attributes and input your values you have written down.
    – Baltok
    Commented Nov 13, 2012 at 21:14
  • 1
    I'm assuming that there are very few features in the imagery that have similar reddish RGB Values. If features other than fire hydrants are selected, I would be alright with that. I also tried the extract by attributes but nothing was extracted by using the dominate red RGB value. The problem may arise from not being able to input all three RGB values into the Query builder because the red color needs the other 2 values. The only options i have to select from in the query builder are ObjectID, Value, and Count so i would not know how to go about creating a query with all 3 RGB values.
    – Sethdd
    Commented Nov 13, 2012 at 21:52
  • Good point. Not sure in that case how to extract just those cells. Hopefully, a raster guru will chime in.
    – Baltok
    Commented Nov 13, 2012 at 22:30

1 Answer 1

10

Your fire hydrants will have a very unique spectral signature, therefore I would use supervised maximum likelihood classification to classify your raster. An alternative is to run an ISODATA algorithm for an unsupervised approach. Try the following (partial) workflow:

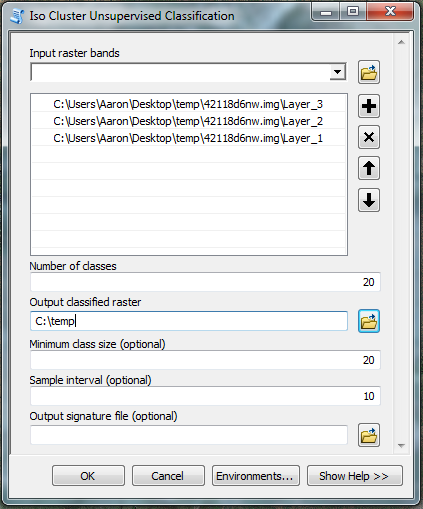
  1. Open Iso Cluster Unsupervised Classification in ArcGIS
  2. Enter ALL 3 bands (i.e. R, G, B) into the GUI (see attached)
  3. Once you have a classified raster, find a hydrant in the raster and use the identify tab to determine the pixel values that make up a hydrant (e.g. pixel values 10 through 14)
  4. Reclassify your image so that all of the pixels that comprise hydrants are classified as "1" and all other values "0". This will produce a binary raster.
  5. Now, display only the 1's as red and the 0's as transparent. You should be able to visually assess the differences now.

Alternatively, for a quantitative approach, run Raster to Polygon to place polygons around your hydrant (i.e. 1) pixels. You can run a host of statistics on your original and derived polygons now.

Keep in mind that you will have more control of the classes if you use supervised maximum likelihood classification

EDIT:

Also try using 4-band CIR high resolution aerial imagery available from Earth Explorer. The near IR (4th) band will give you much greater contrast between the hydrants and the green lawns surrounding them. This is likely an urban area, so you may be able obtain very high resolution imagery for your area of interest.

enter image description here

6
  • This is exactly what I was looking for! I have been playing around with this tool (the unsupervised one) trying varying class sizes and came to the conclusion that 40 offered me the best results. The downside is the pixel values for the fire hydrant are not consecutively ranged (ie 10-14). I have to chose a few values ranging from 3-39. Because I am looking at such a wide range, it's a mess to see just the fire hydrants since it is not capturing the essence of what a fire hydrant is but other. I have a feeling it's because the imagery is not detailed enough to get an unique signature.
    – Sethdd
    Commented Nov 14, 2012 at 17:37
  • @Sethdd I have edited the post to include additional info/ideas.
    – Aaron
    Commented Nov 14, 2012 at 17:51
  • Thanks Arron for the additional info. I looked at Earth Explorer and sadly, their is no high res imagery for the location I need. I made an edit to my original post which explains some success i have had.
    – Sethdd
    Commented Nov 14, 2012 at 18:35
  • I got to thinking lastnight, and was wondering if it would be possible to select a range of RGB values. I'm looking at the RGB value range of each band for the different shades of red on the fire hydrant and found that the range is: R:152-208 G:67-182 B:77-179 I then brought in each band and symbolized the unique value range which is stated above. My thinking is if i can export the range of values from each band through reclassification (each cell = 1), i can then use raster calculator to add each raster output and only keep cells with a value of 3 since that will be my feature.
    – Sethdd
    Commented Nov 15, 2012 at 13:59
  • I checked Earth Explorer and could not find the 2009 imagery that you mentioned. Btw, The location of my study site is in Perth Amboy, NJ. I know OGIS has 2007 imagery that was revised in 2009. Could that be what you are referring to? I checked out that particular dataset and the imagery I have is vastly more detailed. I don't know the scale but it is much better than anything I would be able to find.
    – Sethdd
    Commented Nov 15, 2012 at 14:16

Your Answer

By clicking “Post Your Answer”, you agree to our terms of service and acknowledge you have read our privacy policy.

Not the answer you're looking for? Browse other questions tagged or ask your own question.