If the aim is to minimise restructuring of your data I would consider generating a multipoint geometry in a new field to represent the various locations of each respondent. There are many ways to achieve this.
The most efficient approach would probably use Python but here is one very simple method that doesn't require you to create a new file as long as you have a recent version of Excel.
Generate WKT column. Assuming your data is stored with one pair per column as in the screenshot below, generate a new column for the WKT representation of your multiple points using the Excel formula below.
This strips any commas between x and y and replaces them with a space, then concatenates each coordinate pair (skipping empty values) with the correct syntax to generate a WKT string.
Note - you need a fairly recent version of Excel to access the TEXTJOIN() function. If you don't have that, OR your data is stored with each x and y coordinate in its own column, look at the bottom of this post.
="MultiPoint (("&TEXTJOIN("),(",TRUE,SUBSTITUTE(B2:F2,","," "))&"))"

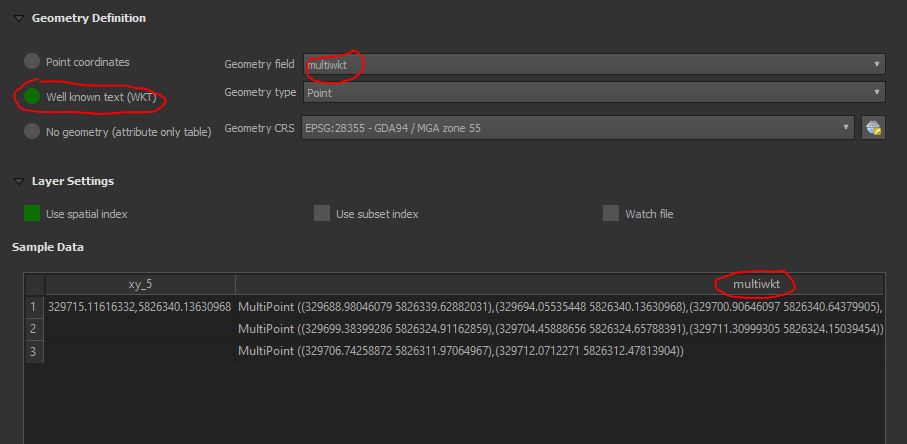
- Import into QGIS using Layer > Add Layer > Delimited Text Layer and select Well known text (WKT) under Geometry definition, specifying the field created in Step 1 as the Geometry field

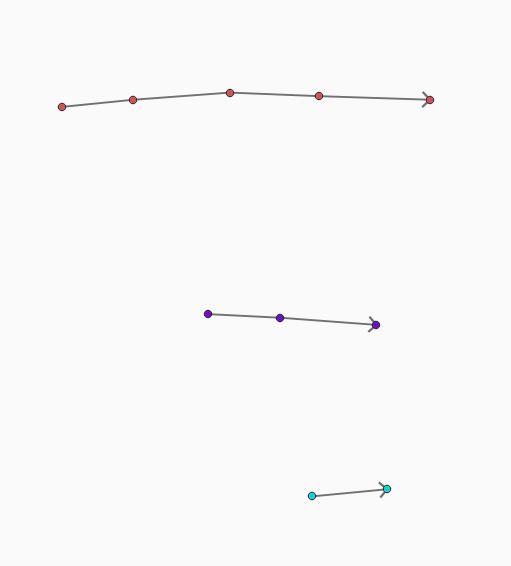
- Style accordingly. You now have multiple points associated with each person/id and can use a categorised style based on ID, or even create a line symbol connecting each point per ID. Use the Geometry generator symbology and the expression below.
make_line(
array_foreach(
generate_series(1,num_geometries($geometry)),
                geometry_n($geometry,@element)))

If you are stuck at step 1 above because you don't have that version of Excel, you could try the following:
- load the CSV in QGIS and generate the WKT representation in a virtual field in Field Calculator with the expression below
'MultiPoint (('||
array_to_string(array_foreach(array("xy_1","xy_2","xy_3","xy_4","xy_5"),
replace(@element,',',' ')),'),(')||'))'
Alternatively, if your data is stored with each coordinate in its own column, i.e. x1, y1, x2, y2, etc. then you can try this expression
geom_to_wkt(collect_geometries(array_filter(array(make_point("x1","y1"),
make_point("x2","y2"),
try(make_point("x3","y3"),null),
try(make_point("x4","y4"),null),
try(make_point("x5","y5"),null)),@element is not null)))
Save the CSV with the virtual field as a new layer/csv so that the WKT representation is actually stored in the file and QGIS can detect and load it.
Follow steps 2 and 3 above the line


