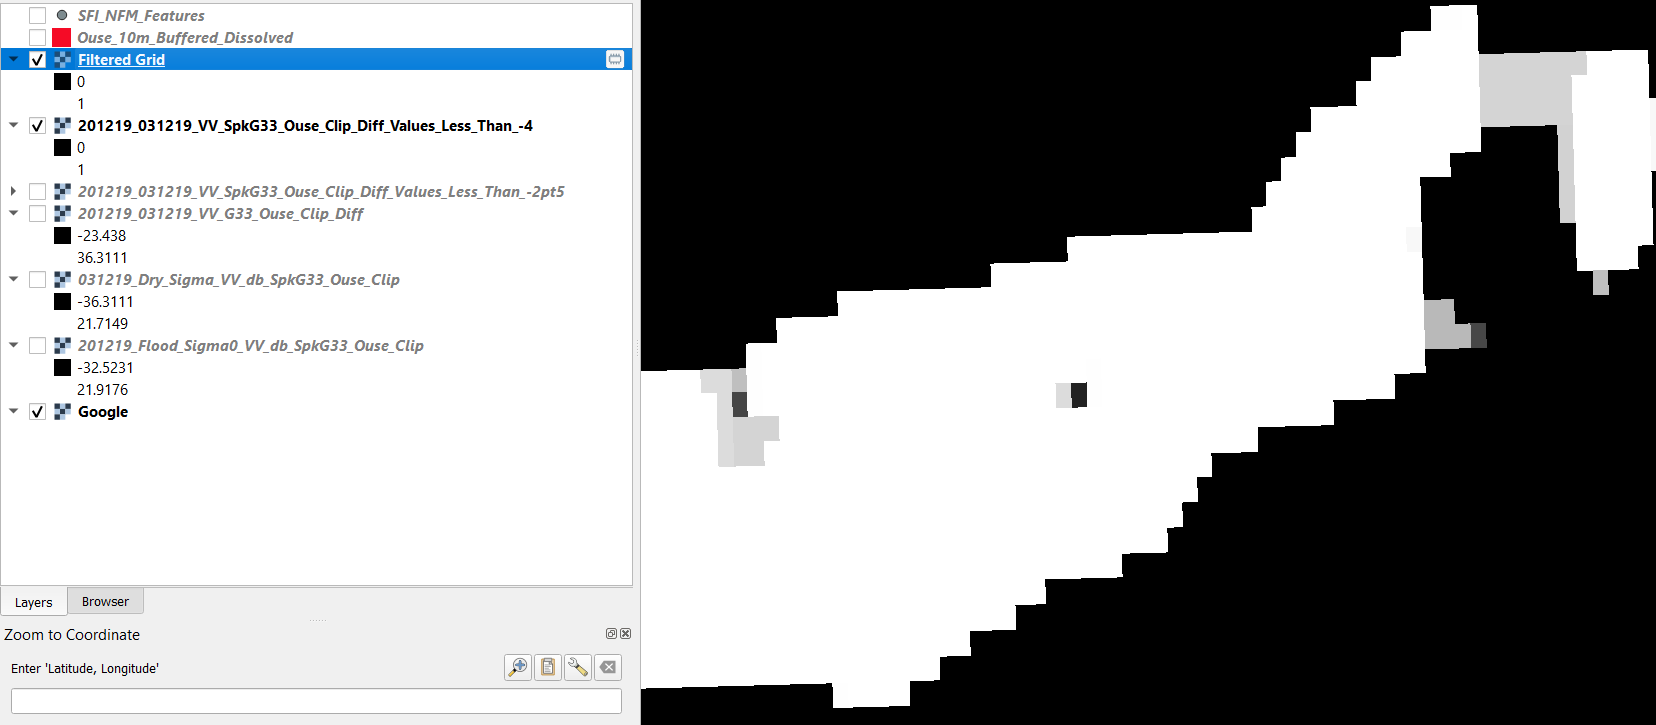
I am using the Majority/Minority SAGA tool in QGIS 3.16.10 on a binary 0,1 raster file to try and smooth the classification. When I run this tool it generates a raster with lots of values between 0 and 1. What do they represent? Image below showing the resulting image where values range between 0 and 1. My understanding was that the output would be an updated binary image where individual cells have been added to clusters of 0 or 1 cells (depending on the threshold setting)
-
Unfortunately, I cannot reproduce this issue at my end. Could you share your data and the tool setup?– KazuhitoCommented Nov 26, 2021 at 23:28
-
See here about the prinicples how majority filter works - it's about ArcGIS, but the very principle is not software specific: desktop.arcgis.com/en/arcmap/10.3/tools/spatial-analyst-toolbox/…– BabelCommented Dec 2, 2021 at 11:48
-
Thanks. I understand the concept of Majority filter , so was surprised that the output produced values say 0.12 or 0.24 from an input that has only 0 and 1 value cells. Therefore I was expecting changed cells to be 0 or 1. Hope that makes sense– Sean JarrettCommented Dec 3, 2021 at 8:42
Add a comment
|
2 Answers
You may need to convert the raster to an SDAT format before running the Majority filter.
you need to transform the format to dat
New contributor
cand laio is a new contributor to this site. Take care in asking for clarification, commenting, and answering.
Check out our Code of Conduct.
-
1Welcome to GIS SE, dear @candlaio. This does not really answer the question. I suggest extending your answer with more information, or deleting it because it fully overlaps with leahb's answer.– Taras ♦Commented 9 hours ago

