0

I have GeoPandas dataframe which has one column with code.

    id     geometry                                                   code
0    1     MULTIPOLYGION (((-52.65767 -13.75468, -52.65767...           1
1    2     MULTIPOLYGON (((-52.64790 -13.73459, -52.64650...            2
...

I want to rasterize the polygon based on "code" field, as described in this tutorial. In addition, I want the rasterized result to be inside defined bounding box:

[-52.6655134035483, -13.78656, -52.5453277772702, -13.6867505007449]

I would like to use GeoCube for that.

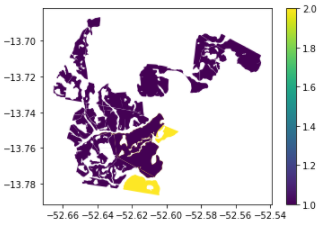
This is how the dataframe looks like when I plot it with GeoPandas:

tmp.plot(column='crop_code',legend=True)

enter image description here

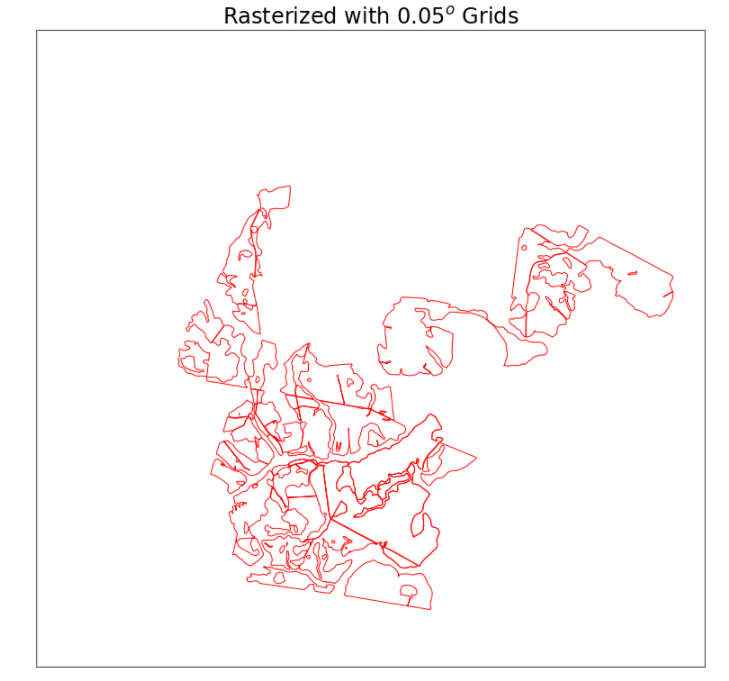
However, when I try to rasterize it using geocube , I get the polygons without the value rasterized:


out_grid = make_geocube(

    vector_data=tmp,

    measurements=["code"],

    output_crs="epsg:4326",

    resolution=(-10,10),

    fill=-9999

)


fig = plt.figure(figsize=(15, 13))
ax = fig.add_subplot(1, 1, 1, projection=ccrs.PlateCarree())

tmp.plot(ax=ax, facecolor='None', edgecolor='r')
da_grib = xr.where(out_grid.code<-1999.0, np.nan, out_grid.code)
da_grib.plot(ax=ax, add_colorbar=False)

#ax.set_extent([112.5, 154.0, -42.116943, -9.142176])
ax.set_title("Rasterized with 0.05$^o$ Grids", fontsize=24);

enter image description here

As it can be seen , the result doesn't have the values of the code and basicaly looks like the empty polygons. Moreover, it is not match to the extent of the bounding box.

My end goal is to get new raster, with the polygons rasterized based on code value, in the bounding box extent. How can I do this?

1 Answer 1

1

I believe there are two problems going on here. The first is that the resolution parameters are way too large. So try something like this instead:

out_grid = make_geocube(
    vector_data=tmp,
    measurements=["code"],
    output_crs="epsg:4326",
    resolution=(-0.1,0.1),
    fill=-9999
)

The bigger the number in the resolution parameter, the larger real-world area each "pixel" will cover.

My second guess is that there's also something funky going on with the plotting itself, specifically the projection=ccrs.PlateCarree() part. So try this instead:

fig = plt.figure(figsize=(15, 13))
ax = fig.add_subplot(1, 1, 1)

tmp.plot(ax=ax, facecolor='None', edgecolor='r')
da_grib = xr.where(out_grid.code<-1999.0, np.nan, out_grid.code)
da_grib.plot(ax=ax, add_colorbar=False)

ax.set_title("Rasterized with 0.1$^o$ Grids", fontsize=24)

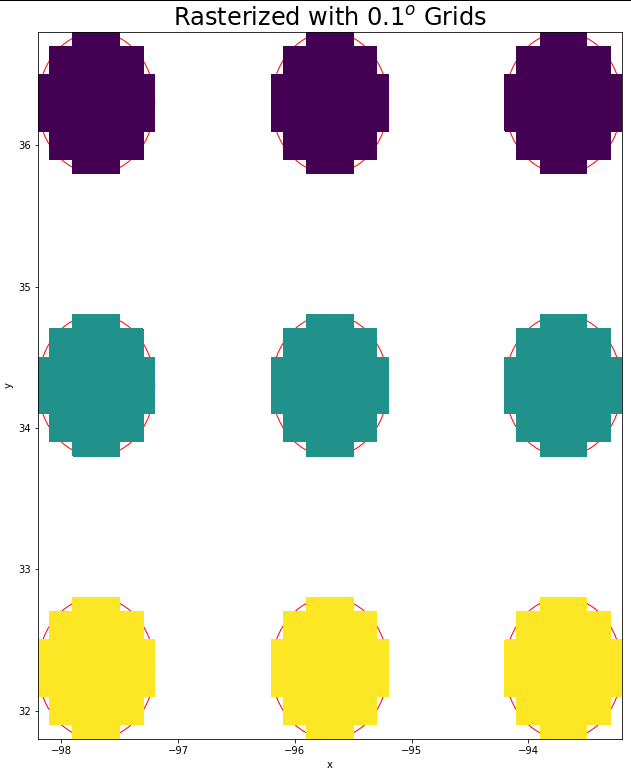
Since I don't have your input data, I can't replicate your case exactly, but this is what it looks like when I create some fake data:

# Importing main libraries used
import numpy as np
import xarray as xr
import geopandas as gpd
from geocube.api.core import make_geocube

import matplotlib.pyplot as plt
import shapely.wkt

# Creating fake data
tmp = gpd.GeoDataFrame({'land_id': [1,2,3,4,5,6,7,8,9],
                        'land_cat': ['A','B','C','B','C','A','C','A','B'],
                        'code': [1,1,1,2,2,2,3,3,3],
                        'pt_wkt':  ['POINT (-97.7 36.3)',
                                    'POINT (-95.7 36.3)',
                                    'POINT (-93.7 36.3)',
                                    'POINT (-97.7 34.3)',
                                    'POINT (-95.7 34.3)',
                                    'POINT (-93.7 34.3)',
                                    'POINT (-97.7 32.3)',
                                    'POINT (-95.7 32.3)',
                                    'POINT (-93.7 32.3)']})

# Making the geometries Polygons instead of just Points
tmp = tmp.set_geometry(tmp['pt_wkt']
                       .apply(lambda pt: 
                              shapely.wkt.loads(pt).buffer(0.5)),
                       crs='epsg:4326')

# Generating GeoCube
out_grid = make_geocube(
    vector_data=tmp,
    measurements=["code"],
    resolution=(-0.1, 0.1),
    fill=-9999
)

# Plotting
fig = plt.figure(figsize=(15, 13))
ax = fig.add_subplot(1, 1, 1)

tmp.plot(ax=ax, facecolor='None', edgecolor='r')
da_grib = xr.where(out_grid.code<-1999.0, np.nan, out_grid.code)
da_grib.plot(ax=ax, add_colorbar=False)

ax.set_title("Rasterized with 0.1$^o$ Grids", fontsize=24)

GeoCube

Your Answer

By clicking “Post Your Answer”, you agree to our terms of service and acknowledge you have read our privacy policy.

Not the answer you're looking for? Browse other questions tagged or ask your own question.