1

TL;DR: Creating nice symbologies for a single layer, where a dotted line doesn't display underneath a dashed line, for sections where the dashed line is a symbology for a larger, more important area. In QGIS.

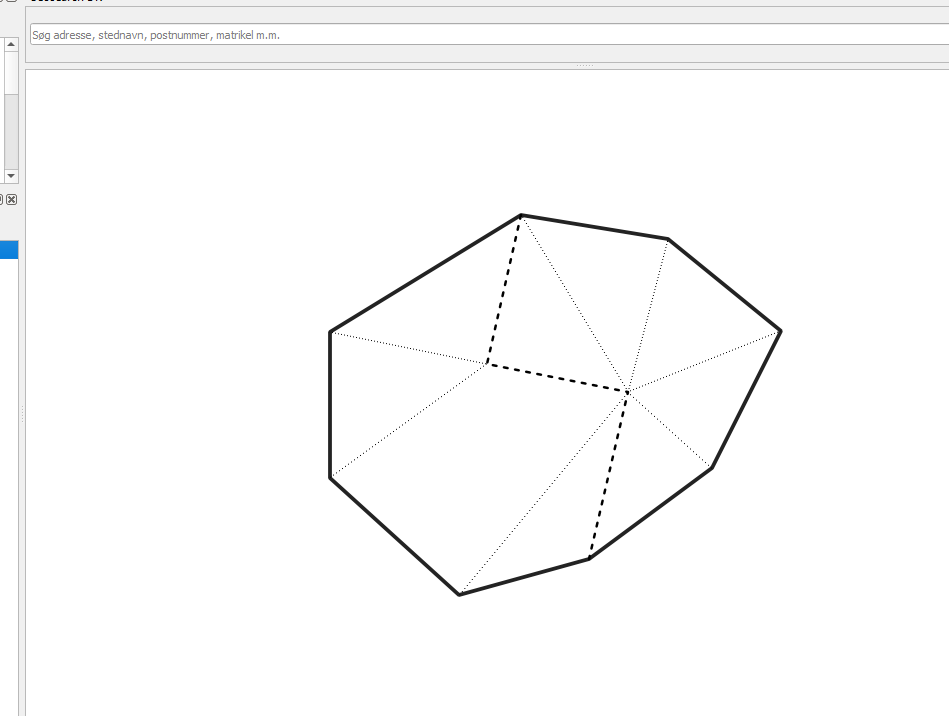
  • How i would like the symbology to be:enter image description here

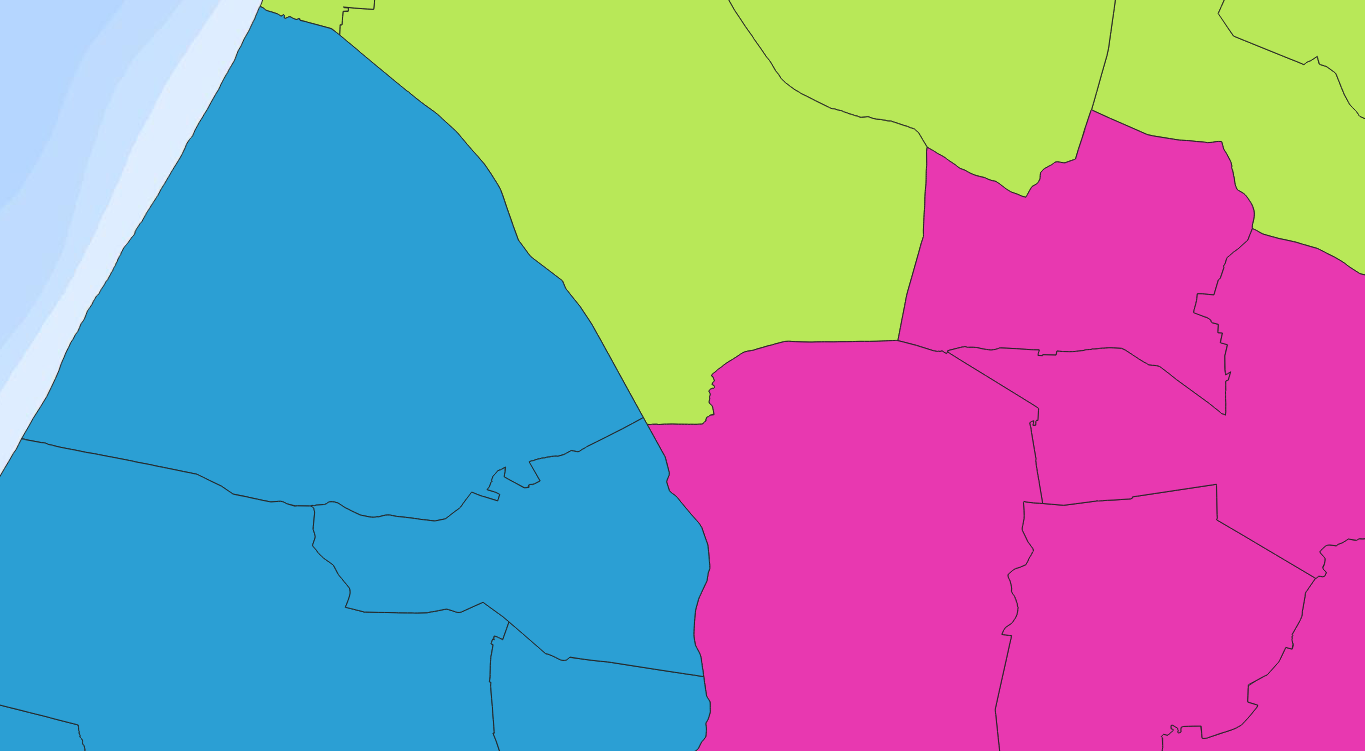
  • How the data is organized with filled polygons:enter image description here

I'm new to the rule-based symbologies, and i have next to no SQL knowledges, so the solution doesn't strike me intuitively yet - although i see the great potential of the feature already, and thus believe that this is the way to handle it.

What i seek help to achieving, is portraying boundaries in a presentable way. Let's call them state and town administrative boundaries, as it is very much similar. I've created a polygon layer where i originally had the towns division, and arranged them into states and countries by attribute values. Now i seek to display it in a nice way. Lets say dotted line for towns, dashed for states and a full line for countries. Doing this by traditional simple symbologies creates a dotted line beneath the dashed, and i wish to avoid this. I'm convinced it can be done by rulebased de-selection of sections that is used for a higher level in the hierarchy, but can't figure it out.

Screenshot of the polygon layer i'm working on. Black borders are the smallest division, coloured areas are grouped by attribute field. And everything in this picture - besides the sea - is grouped by a second attribute as a third and highest tier, that i also wish to apply the symbology rule for in a full black border line, with the two divisions as dotted and dashed respectively, without interferearing each others.

3
  • Can you post a screenshot that shows the result you want to achieve?
    – Babel
    Commented Aug 2, 2022 at 10:25
  • Yes. Imagine three tiers, 1,2,3. In the small screen shots, black bordered polygons are 3 the lowest, these i would like to have dotted bordering symbologies. The coloured areas are combined in tier 2, where the colours should not be included, but instead defined again around them, with a dashed line for which the underlying tier 3 doesn't not get shown, as they would make the symbology unclear. In the end, everything i work with should have one defining full line as symbology around it. link Commented Aug 2, 2022 at 10:49
  • 1) Post the picture in you initial post, not as a comment (edit the question); 2) the picture does not show how the result should look like
    – Babel
    Commented Aug 2, 2022 at 10:50

1 Answer 1

0

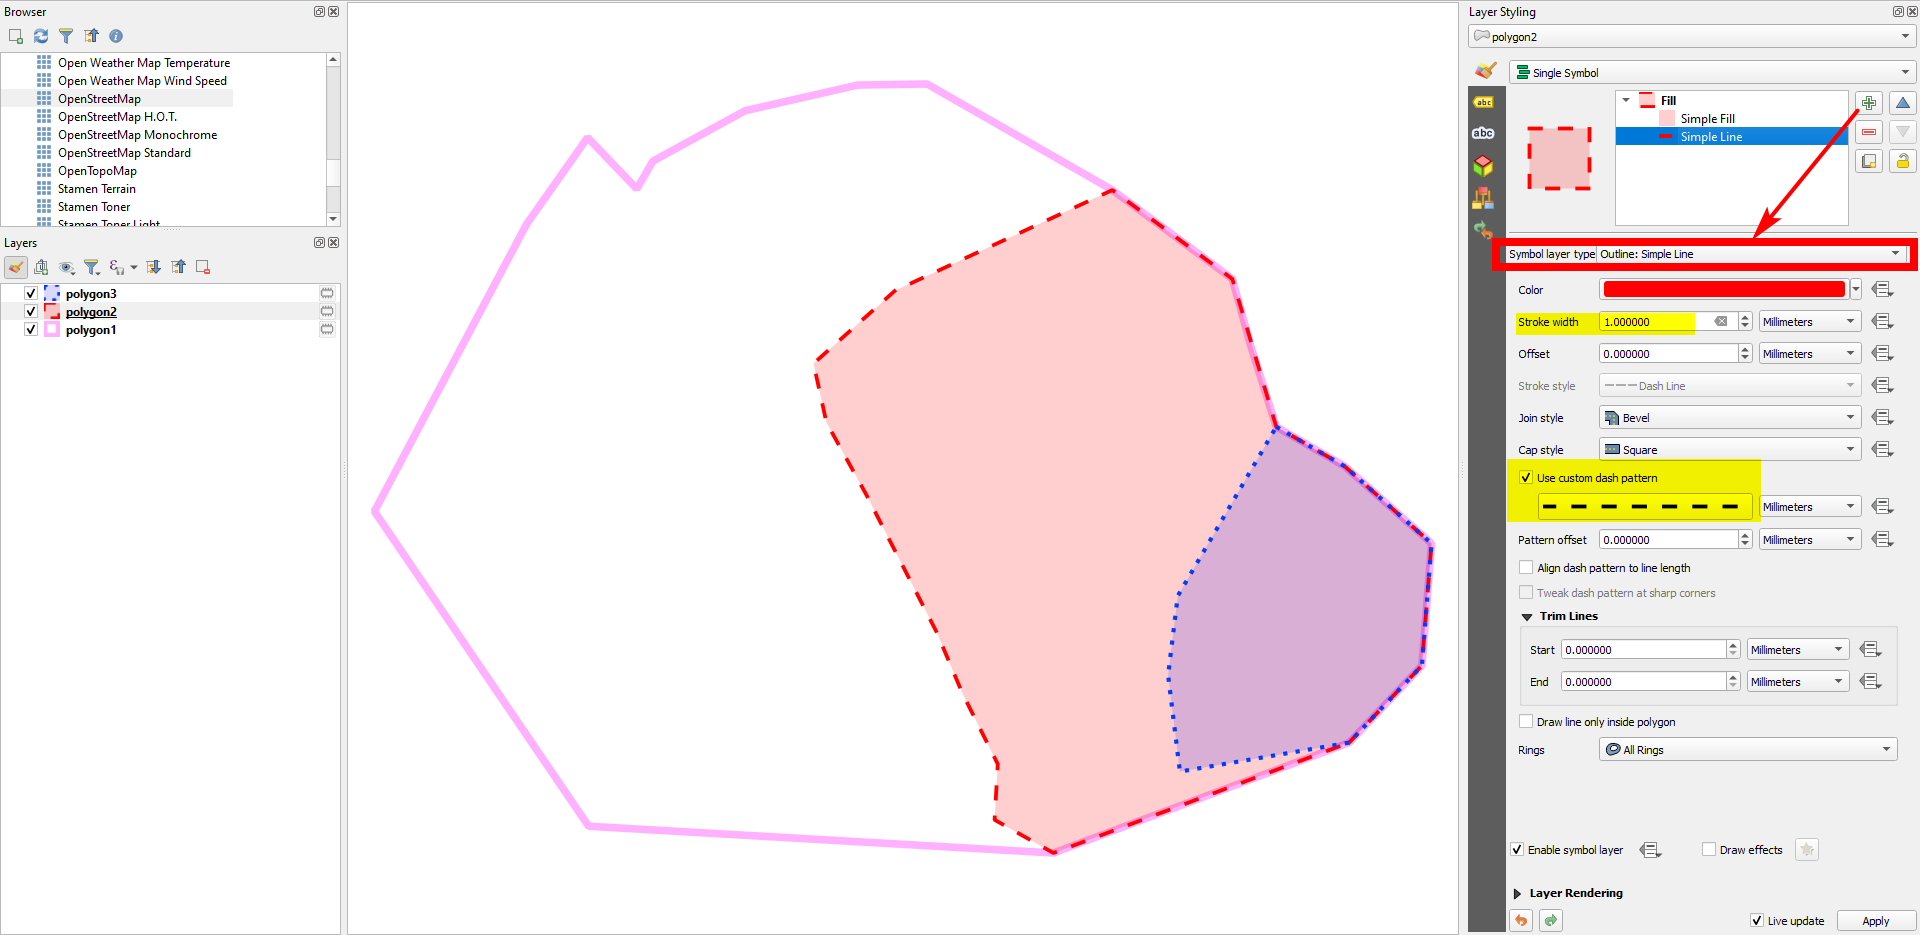
Set the outline of the polygons to No Pen, then add an additional symbol layer of the type Outline: Simple line. There, you can make custom settings as shown in the following screenshot:

enter image description here

Edit

As you have everything on the same layer, you need to apply a different approach:

  1. Create an own symbol layer for each admin level and order them accordingly (highest hierarchical level on the top).

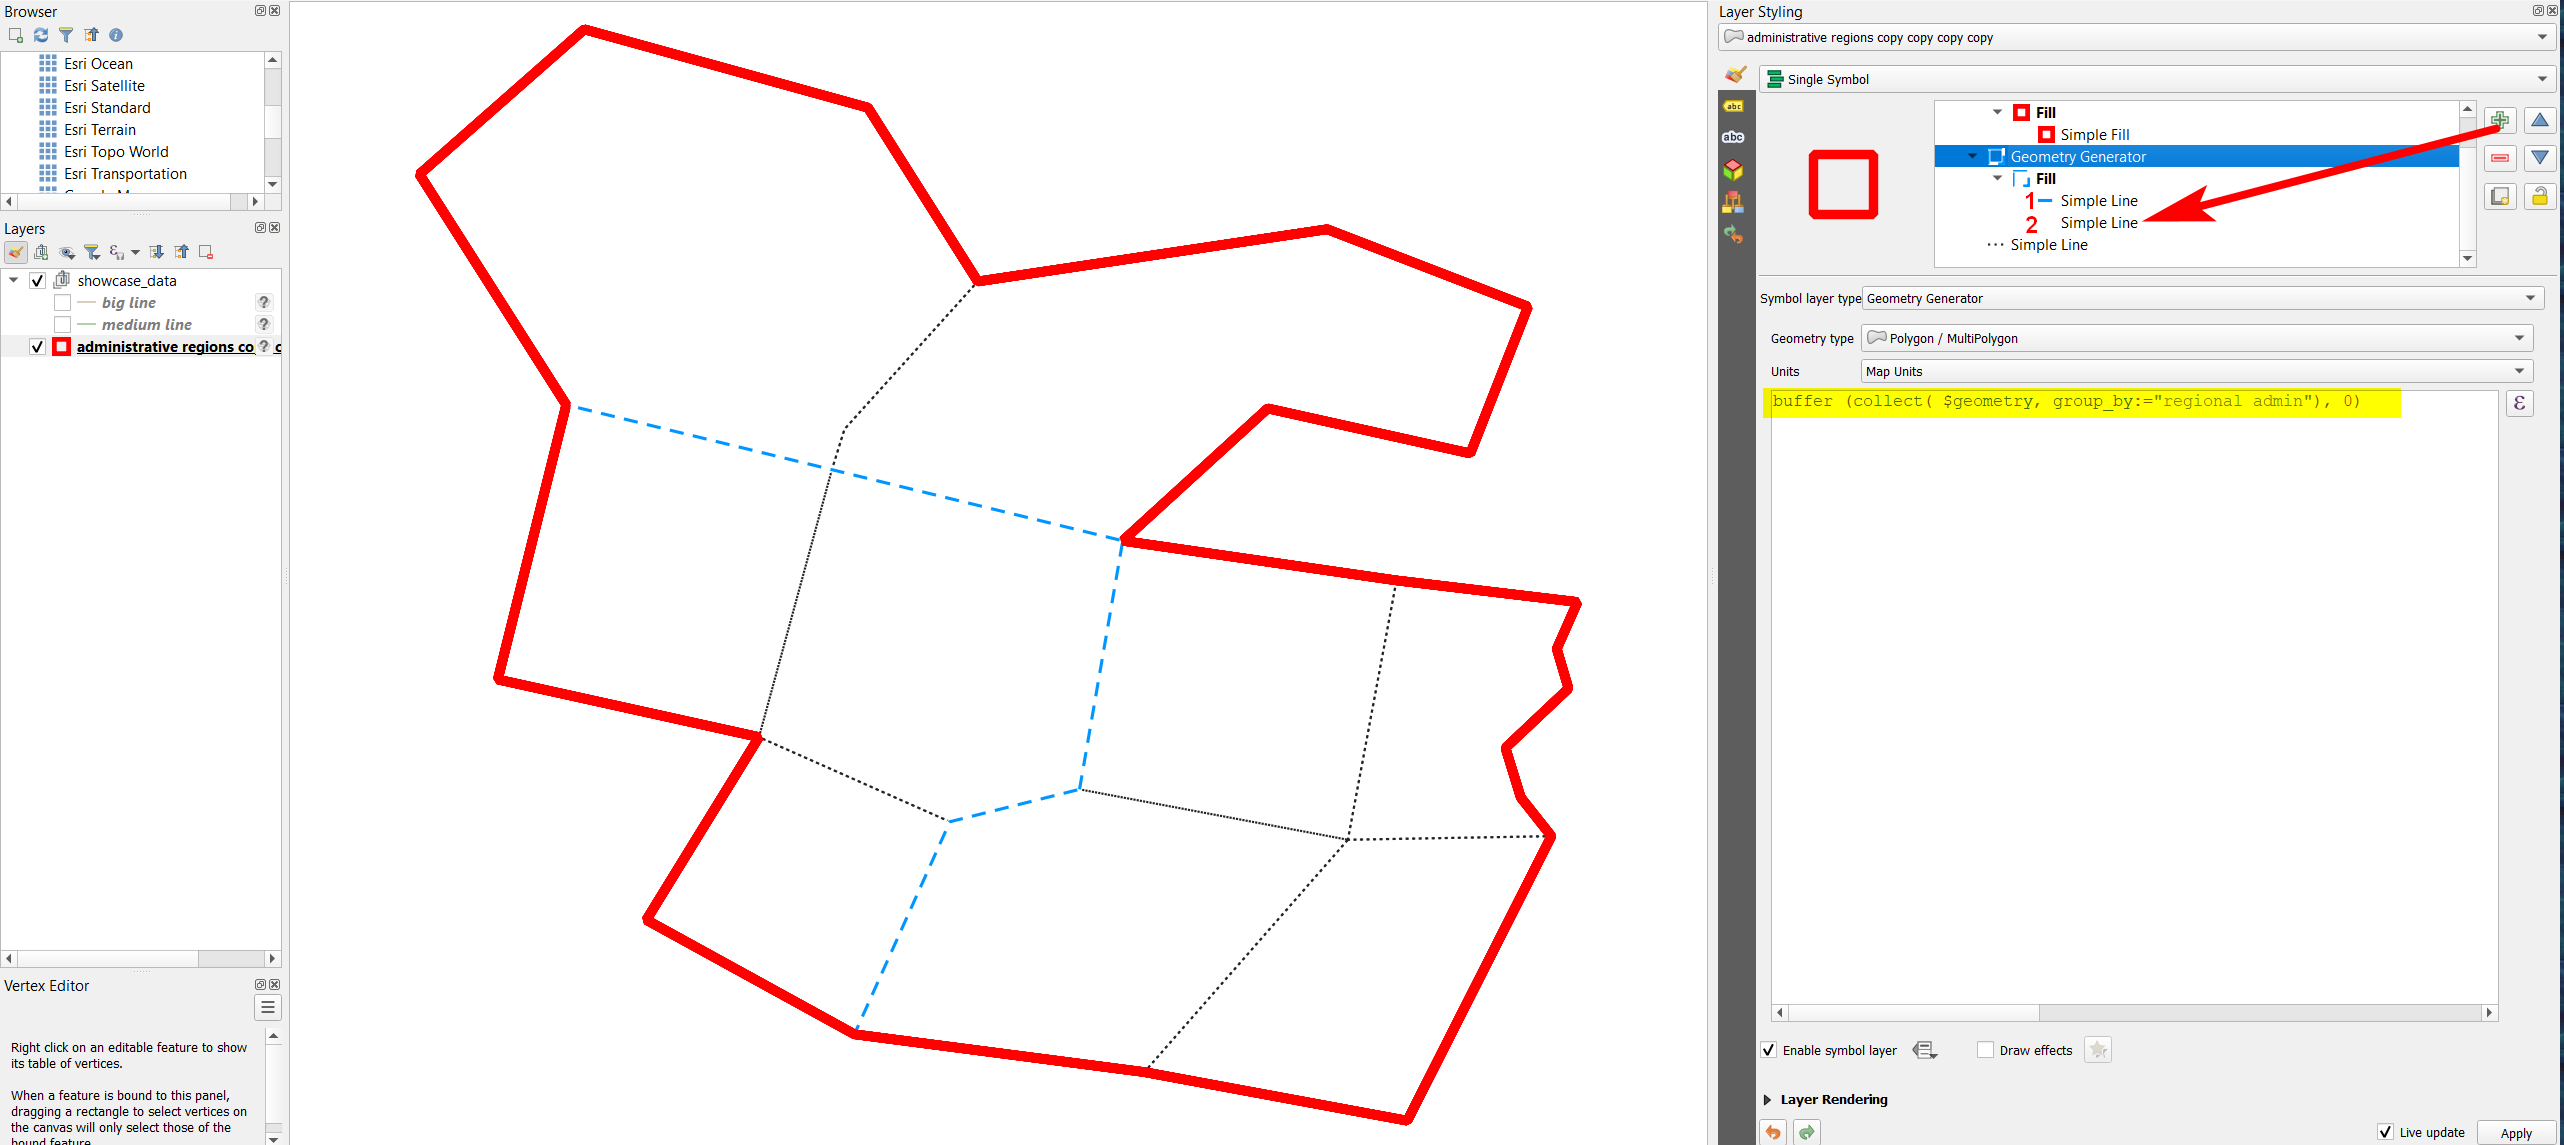
  2. To get the red outline, set the top symbol layer to type to Geometry Generator and paste this expression: buffer (collect( $geometry), 0), then style the solid outline. The expression creates one single polygon from all features.

  3. To get the blue dashed line, this time in the Geoemetry generator paste this expression to get different polygons for each regional_admin level: buffer (collect( $geometry, group_by:="regional admin"), 0). Again style the line (I used Outline: Simple Line) to get the dashed blue line.

  4. Repeat the same for the local level. Here, you don't need a Geoemtry generator, as each individual polygon should be represented.

  5. If you now want to hide the black dotted line under the blue dashed line, there is a trick: click on the Simple Line entry (the one that generates the blue line, no. 1 in the screenshot) and press the green plus to add another line style. Set this (no. 2 on the screenshot) to a solid white line so that it covers everythin underneath: the black dotted line will be covered by the white one, whereas the blue dahsed line is still visible.

See details on the screenshot:

enter image description here

9
  • Very close, but not exactly what i was looking for - i was looking for a way to eliminate the overlaying symbologies that results from your example also. Where the pink "layer 1" and the red dashed "layer 2" is joined. In that case, i only want one symbology to show. In your example the pink one, as it's the highest in the hierachy. Commented Aug 4, 2022 at 13:05
  • Then bring the pink layer 1 to the top so that it covers all the other layers. If it is thicker then the red dashed line, the pink line will cover the other ones.
    – Babel
    Commented Aug 4, 2022 at 13:13
  • Thank you for answering so fast - while you answered, i made an example of what i'm trying to achieve. The dilemma i want to stress, is that the data is all the same layer. A large data set in fact, and when using the simple tools, what i always end up with, is a dotted line underneath the dashed line. I do not want this, and my best guess to avoid this, is to use a rule system in which i have no experience, based on attributes that is available. What marks the division i want do have X,Y,Z attributes. Commented Aug 4, 2022 at 13:34
  • Can you share a sample of your data? It's quite difficult to guess how the solution should look like without knowing how your data looks like
    – Babel
    Commented Aug 4, 2022 at 13:52
  • I'd like to - however the exact files are restricted, i've thus created a basic replacement with the same structure. To keep to the scenario, there's three tiers of public administration zones in the example. The example file: link Describing imagine of content: link There's three attributes in the same layer. The line layers are illustrating division points i whish. Highlight shows conflict between dots and dash. Commented Aug 4, 2022 at 14:47

Your Answer

By clicking “Post Your Answer”, you agree to our terms of service and acknowledge you have read our privacy policy.

Not the answer you're looking for? Browse other questions tagged or ask your own question.