0

In the H3-JS example I have, it is implemented in mapbox. But I would like to integrate the H3-JS binning as part of Openlayers map instead. This is the example I want to implement in OpenLayers. https://github.com/agrc/gis.utah.gov/tree/master/developer/applications/suitability

I had asked this question at the Mapbox Github repo, and was told it can be done. https://github.com/uber/h3-js/issues/160#issuecomment-1251248799

function renderHexes(map, hexagons) {
      console.log("renderHexes");

      // Transform the current hexagon map into a GeoJSON object
      // const geojson = geojson2h3.h3SetToFeatureCollection(
        binnedGeoJSON = geojson2h3.h3SetToFeatureCollection(
        Object.keys(hexagons),
        (hex) => ({ value: hexagons[hex] })
      );

      const sourceId = "h3-hexes";
      const layerId = `${sourceId}-layer`;
      let source = map.getSource(sourceId);

      // Add the source and layer if we haven't created them yet
      if (!source) {
        map.addSource(sourceId, {
          type: "geojson",
          data: binnedGeoJSON, //geojson,
        });
        map.addLayer({
          id: layerId,
          source: sourceId,
          type: "fill",
          interactive: false,
          paint: {
            "fill-outline-color": "rgba(0,0,0,0)",
          },
        });
        source = map.getSource(sourceId);           
      }

      // Update the geojson data
      source.setData(binnedGeoJSON); //geojson);
      //Call my new function to carry out H3-JS in Openlayers
      newMap(binnedGeoJSON);
      console.log('end tomap2')

      // Update the layer paint properties, using the current config values
      map.setPaintProperty(layerId, "fill-color", {
        property: "value",
        stops: [
          [0, config.colorScale[0]],
          [0.5, config.colorScale[1]],
          [1, config.colorScale[2]],
        ],
      });

      map.setPaintProperty(layerId, "fill-opacity", config.fillOpacity);
    }

And my new function is

function newMap(geoJSON)
{
    console.log('Begin NewMap Function: ');
    var coord = [-76.95266723632812, 39.07974903895123];
    
    var features = new ol.format.GeoJSON().readFeatures(geoJSON, { //geojsonObject
    featureProjection: 'EPSG:3857'
    });

    var vectorSource = new ol.source.Vector({ features: features });
    var vectorLayer = new ol.layer.Vector({
        source: vectorSource,
            style: function (feature, resolution) {
                console.log(feature.getProperties(), feature.get('marker-color'));
                return [new ol.style.Style({
                image: new ol.style.Circle({
                    radius: 10,
                    fill: new ol.style.Fill({ color: feature.get('marker-color') })
                })
                })];
        }
    });

    var map3 = new ol.Map({
        target: 'map3',
            layers: [
                new ol.layer.Tile({ source: new ol.source.OSM() }),
                vectorLayer
            ],
            view: new ol.View({
                center: ol.proj.fromLonLat(coord),
                zoom: 5
            })
    });
    // Add the created layer to the Map
    //map3.addLayer(vectorLayer);
    console.log('End NewMap Function: ');
}

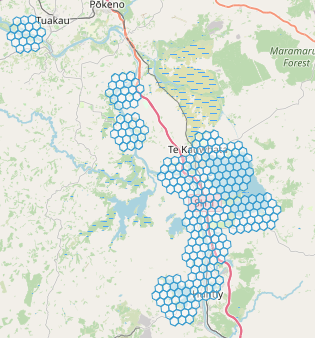
But still the H3-binning results are now shown in the OpenLayers map. Maybe I have to find the Openlayers equivalent for the following function.

So my main question is how to convert the below code block in Mapbox into Openlayers?

// Update the layer paint properties, using the current config values
  map.setPaintProperty(layerId, "fill-color", {
    property: "value",
    stops: [
      [0, config.colorScale[0]],
      [0.5, config.colorScale[1]],
      [1, config.colorScale[2]],
    ],
  });

Upon commenting out the style function, as suggested by Mike, I only get the frames pf the hexagons. They are not shaded and also binning needs to be carried out.

Please advice.

enter image description here

[![enter image description here][2]][2]

2
  • 1
    If you comment out the style function do you see hexagons in the OpenLayers default style? If not you may need to specify dataProjection: 'EPSG:4326', in addition to featureProjection: 'EPSG:3857'. How does marker-color relate to your original code? To style a polygon with an image with you would to set the style geometry to its interior point. For fill-color your style function could set different fill colors depending on a feature property value.
    – Mike
    Commented Oct 10, 2022 at 13:18
  • Hi Mike, thank you. Commenting out the style shows the hexagons in Openlayers. But only shows frames of the hexagons - they are not shaded inside. I now also have to code it so that the hexagons get smaller or bigger based on the binning parameters. Are you able for chat?
    – SharmaPN
    Commented Oct 11, 2022 at 11:35

1 Answer 1

2

If you wish to style the features according to a property "value" as the the Mapbox code you should create corresponding OpenLayers fill styles from your colorScale array

var outlineColor = 'rgba(0,0,0,0)';
var styles = config.colorScale.map(function(fillColor) {
  return new ol.style.Style({
    stroke: new ol.style.Stroke({
      color: outlineColor,
      width: 1,
    }),
    fill: new ol.style.Fill({
      color: fillColor,
    }),
  });
});

then you can use a style function to return the appropriate style

style: function (feature, resolution) {
  var value = feature.get('value');
  return styles[value < 0.5 ? 0 : value < 1 ? 1 : 2];
}),

If you have two sets of data from h3 (geojson and binnedGeoJSON?) it will probably be easier to use a separate OpenLayers source and layer for each.

UPDATE

Your Mapbox code is interpolating colors instead of using simple stops, which will make the OpenLayers style function more involved, as it will need to calculate interpolated colors:

function interpolateColor(value, stops, colors) {
  const index = stops.findIndex((stop) => value <= stop);
  if (index < 0) {
    return colors[colors.length - 1];
  }
  if (index === 0) {
    return colors[0];
  }
  const startColor = ol.color.asArray(colors[index - 1]);
  const endColor = ol.color.asArray(colors[index]);
  const startStop = stops[index - 1];
  const endStop = stops[index];
  const result = [0, 0, 0, 0]
  for (let i = 0; i < 4; ++i) {
    result[i] = startColor[i] + ((endColor[i] - startColor[i]) * (value - startStop) / (endStop - startStop))
  }
  return ol.color.asString(result);
}

var outlineColor = 'rgba(0,0,0,0)';
var style = new ol.style.Style({
  stroke: new ol.style.Stroke({
    color: outlineColor,
    width: 1,
  }),
  fill: new ol.style.Fill(),
});

and set that in the returned style

style: function (feature, resolution) {
  var value = feature.get('value');
  style.getFill().setColor(interpolateColor(value, [0, 0.5, 1], config.colorScale))
  return style;
}),

Working example https://jsbin.com/nosoyonemi/edit?html,output (without your school and bus stop local data)

8
  • Hi Mike, this is not working. the map is not showing now. I know you know what you are doing. Thus, I was wondering if you can modify the original example using mapbox, so that it uses openlayers. If that works then it would be easier for me. github.com/agrc/gis.utah.gov/blob/master/developer/applications/…
    – SharmaPN
    Commented Oct 13, 2022 at 2:10
  • I have update the answer
    – Mike
    Commented Oct 14, 2022 at 15:54
  • Thanks it works. I dont have enough reputation to mark this as the answer but this is the answer.
    – SharmaPN
    Commented Oct 15, 2022 at 3:32
  • Dear Mike, You have answered the main question. I was just wondering how to implement the Buffer Radius option where users can choose the radius. Please see example here - but its in mapbox map. I was wondering how to do that in Openlayers, especially in the jsbin example you have created. observablehq.com/@nrabinowitz/… I can post this as a separate question here.
    – SharmaPN
    Commented Oct 15, 2022 at 9:30
  • On that page, on the right, three dots, there is an option to Export and Download Code.
    – SharmaPN
    Commented Oct 15, 2022 at 9:40

Your Answer

By clicking “Post Your Answer”, you agree to our terms of service and acknowledge you have read our privacy policy.

Not the answer you're looking for? Browse other questions tagged or ask your own question.