0

I tried to generate a chart for values of multiple points for AOD taking help of the very helpful video: https://www.youtube.com/watch?v=5bOO0PJJMf0. However, I'm unable to get GEE to recognize values of more than one point in a collection of 7.

Here's the code:

var maod = ee.ImageCollection("MODIS/006/MCD19A2_GRANULES"),
    kanpur = 
    /* color: #70d68e */
    /* shown: false */
    ee.FeatureCollection(
        [ee.Feature(
            ee.Geometry.Polygon(
                [[[78.5614794892115, 27.630292998342572],
                  [78.5614794892115, 25.170437036589544],
                  [81.840898434524, 25.170437036589544],
                  [81.840898434524, 27.630292998342572]]]),
            {
              "1": "Bound",
              "system:index": "0"
            })]),
    MultiPointAOD = /* color: #f70000 */ee.FeatureCollection(
        [ee.Feature(
            ee.Geometry.Point([80.4291552704615, 26.511722460604513]),
            {
              "system:index": "0"
            }),
        ee.Feature(
            ee.Geometry.Point([81.51954833686774, 27.087836554978104]),
            {
              "system:index": "1"
            }),
        ee.Feature(
            ee.Geometry.Point([81.21055785835212, 25.521349742082215]),
            {
              "system:index": "2"
            }),
        ee.Feature(
            ee.Geometry.Point([79.67762384859742, 25.384298993749066]),
            {
              "system:index": "3"
            }),
        ee.Feature(
            ee.Geometry.Point([79.03663818061774, 26.351856976593158]),
            {
              "system:index": "4"
            }),
        ee.Feature(
            ee.Geometry.Point([79.34425536811774, 27.434530441120618]),
            {
              "system:index": "5"
            }),
        ee.Feature(
            ee.Geometry.Point([80.71754638374274, 27.087836405728336]),
            {
              "system:index": "6"
            })]),
    geometry = 
    /* color: #d63000 */
    /* shown: false */
    /* displayProperties: [
      {
        "type": "rectangle"
      },
      {
        "type": "rectangle"
      }
    ] */
    ee.FeatureCollection(
        [ee.Feature(
            ee.Geometry.Polygon(
                [[[78.577958981399, 27.636673418136443],
                  [78.577958981399, 25.181926141677547],
                  [81.8463915985865, 25.181926141677547],
                  [81.8463915985865, 27.636673418136443]]], null, false),
            {
              "system:index": "0"
            }),
        ee.Feature(
            ee.Geometry.Polygon(
                [[[81.84364501655524, 25.216718878626583],
                  [81.84364501655524, 25.14215084694132],
                  [81.84364501655524, 25.14215084694132],
                  [81.84364501655524, 25.216718878626583]]], null, false),
            {
              "system:index": "1"
            })]);

var aod = maod
              .filterDate('2019-01-01', '2019-12-31')
              .map(function(image){return image.clip(kanpur)})
              .select('Optical_Depth_055');

Map.centerObject(kanpur,8);

var aoc = {
  min: 380,
  max: 700,
  palette: ['black', 'blue', 'purple', 'cyan', 'green', 'yellow', 'red']
};
var aodavg = aod.reduce(ee.Reducer.mean());
Map.addLayer(aodavg, aoc, "AOD Monthly Average");

var chart = 
      ui.Chart.image
          .series({
            imageCollection: aod, 
            region: kanpur, 
            reducer: ee.Reducer.mean(), 
            scale: 500, 
            // xProperty: 'system_time_start'
          })
          .setSeriesNames(['Aerosol Optical Depth'])
          .setOptions({
            title: 'AOD MODIS Time Series', 
            hAxis: {title: 'Date', titleTextStyle: {italic: false, bold: true}}, 
            vAxis: {
              title: 'AOD Value', 
              titleTextStyle: {italic: false, bold: true}
            },
            lineWidth: 5, 
            colors: ['e37d05'],
            curveType: 'function'
          });
// print(chart);

var points = ee.FeatureCollection(MultiPointAOD);
var pointsamp = points.map(function(feature){
  return ee.Feature(feature.kanpur(), {'id': feature.id()});
});

var char2 = ui.Chart.image.seriesByRegion({
  imageCollection: aod, 
   regions: pointsamp, 
   reducer: ee.Reducer.mean(), 
}).setOptions({
      interpolateNulls: true, 
      lineWidth: 1, 
      pointSize: 3, 
      title: 'Overtime AOD at diff hotspots', 
      vAxis: {title: 'AOD Value'}, 
      hAxis: {title: 'Date', format: 'YYYY-MMMM', gridlines: {count: 12}},
      colors: ['blue', 'yellow', 'red']
});
print(char2);

1 Answer 1

1

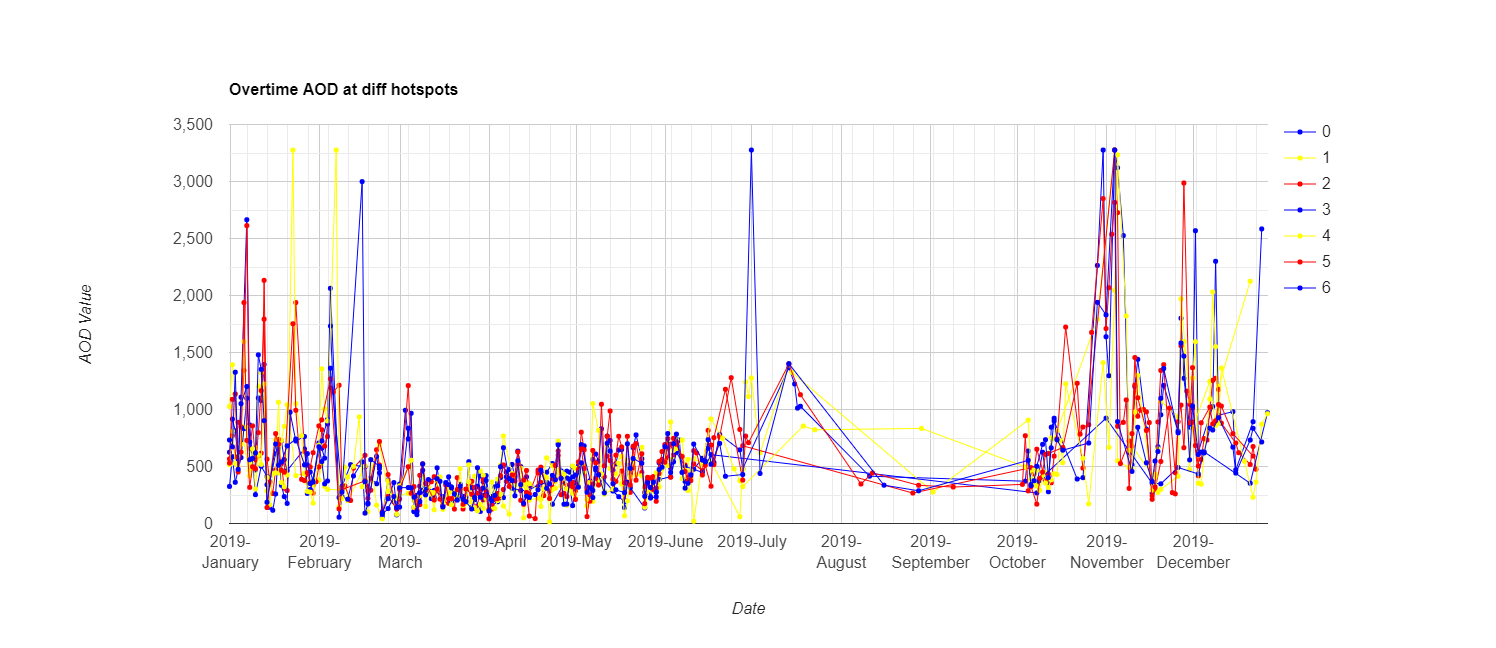
There are three things that are responsible of the errors: 1) there is an error in the part defining pointsamp, 2) there is a limit in the number of objects that GEE can show in a plot or in the console (i.e., 5000 elements), and 3) finally, you need to specify a scale or crs parameter in ui.Chart.image.seriesByRegion. Errors number 1 and 3 can easily be fixed, however, to reduce the number of elements, I assumed you were interested in obtaining a mean value for each day of the year. Thus, this solution makes first a collection of images representing the daily average and then using that collection to make the chart (while reducing the number of elements being shown in the chart).

var points = ee.FeatureCollection(MultiPointAOD);
print('points', points);
var pointsamp = points.map(function(feature){
  // Removed the kanpur part
  return ee.Feature(feature).set('id', feature.id());
});
print('pointsamp', pointsamp);

// Too many images in aod, lets make one per day
var days = aod.aggregate_array('system:time_start')
              .map(function(date){
                return ee.Date(date).format('y-M-d');
              })
              // Get distinct dates
              .distinct();
              
print('days', days);

// Create new collection from daily images
var aod2 = ee.ImageCollection.fromImages(days.map(function(date){
  var start = ee.Date(date);
  var end = start.advance(1,'day');
  
  var resul = aod.filterDate(start, end)
                 .mean();
  
  return resul.set('system:time_start', start);               
}));
print('aod2', aod2);

// Now do the chart
var char2 = ui.Chart.image.seriesByRegion({
   imageCollection: aod2, 
   regions: pointsamp, 
   reducer: ee.Reducer.mean(), 
   // Need to define scale
   scale:500
}).setOptions({
      interpolateNulls: true, 
      lineWidth: 1, 
      pointSize: 3, 
      title: 'Overtime AOD at diff hotspots', 
      vAxis: {title: 'AOD Value'}, 
      hAxis: {title: 'Date', format: 'YYYY-MMMM', gridlines: {count: 12}},
      colors: ['blue', 'yellow', 'red']
});
print(char2);
chart

Your Answer

By clicking “Post Your Answer”, you agree to our terms of service and acknowledge you have read our privacy policy.

Not the answer you're looking for? Browse other questions tagged or ask your own question.