I need to configure a pseudocolour symbology of a raster image using a colour map file in txt format using PyQGIS, how can I do it, and what class allows me to access this configuration?
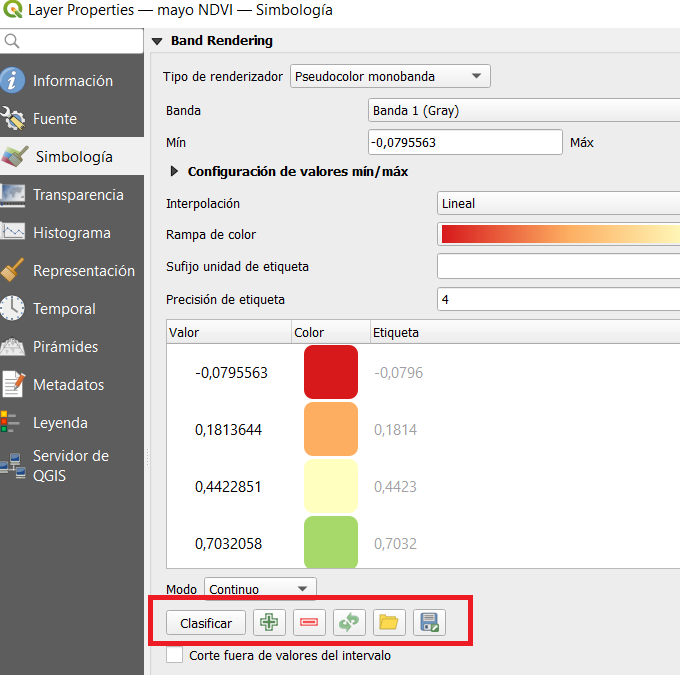
This can be done manually with the buttons located at the bottom of the Layer Properties, in the pseudocolour symbology settings. The buttons highlighted in the image
The text file with the symbology that is generated and can be loaded by QGIS has the following content:
##Archivo de exportación de mapa de colores generado por QGIS
INTERPOLATION:INTERPOLATED
0.11247780174017,215,25,28,255,0,1125
0.32547278888523601,253,174,97,255,0,3255
0.53846777603030205,255,255,192,255,0,5385
0.75146276317536798,166,217,106,255,0,7515
0.96445775032043501,26,150,65,255,0,9645

