1

I have a 37 band image that I hoping to transform so that each row is a pixel and each column a band. I am following what was suggested in this post: Create pandas DataFrame from raster image - one row per pixel with bands as columns

which works perfectly except that it does not preserve the x, y coordinates which I need to merge with a different dataset. I'm wondering if there is a way to store the coordinates in a column when using transpose.

Below is the code provided to get df with rows as pixels/columns as bands:

img=rasterio.open("img.tif")
show(img,0)

#read image 
array=img.read()

#create np array
array=np.array(array)

#flatten and transpose array
pd.DataFrame(array.reshape([37,-1]).T)

0

2 Answers 2

3

Try this:

import rasterio
import numpy as np
import pandas as pd
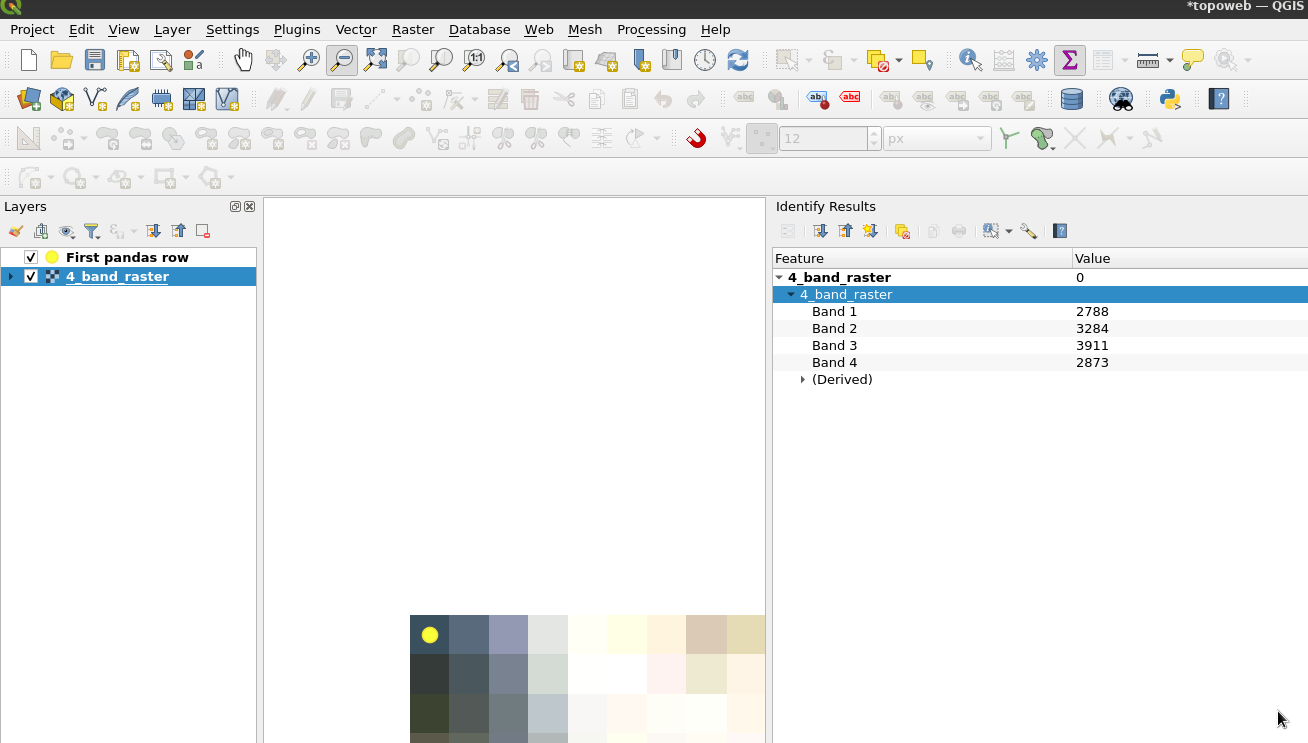
img = rasterio.open(r"/home/bera/Desktop/GIStest/4_band_raster.tif") #A four band sentinel 2 image

array = img.read()
n_bands = array.shape[0]

#Create two 2d arrays of the pixel X and Y coordinates
height = img.shape[0]
width = img.shape[1]
cols, rows = np.meshgrid(np.arange(width), np.arange(height))
xs, ys = rasterio.transform.xy(img.transform, rows, cols)
xcoords = np.array(xs)
ycoords = np.array(ys)

array = np.concatenate((array, xcoords[None,:,:], ycoords[None,:,:]))
#array.shape
#(6, 10980, 10980)
#First 4 dimensions are the four bands in the input image, 5 and 6 are x and y pixel coordinates

df = pd.DataFrame(array.reshape([n_bands+2,-1]).T, columns=[f"band_{i+1}" for i in range(n_bands)]+['x','y'])

#    band_1  band_2  band_3  band_4         x          y
#   2788.0  3284.0  3911.0  2873.0  499985.0  6800035.0
#   3542.0  3877.0  4615.0  3608.0  499995.0  6800035.0
#   5004.0  4941.0  5959.0  4965.0  500005.0  6800035.0
#   6947.0  6660.0  7136.0  7395.0  500015.0  6800035.0
#   8096.0  7431.0  7590.0  8920.0  500025.0  6800035.0

enter image description here

2

I was able to get what I needed less elegantly with the below:

#load in multi banded raster
banded=rxr.open_rasterio('data.tif',masked=True).squeeze()

#capture number of bands
print(banded.shape) #37 bands
band_names=list(banded.attrs["long_name"])
print(len(band_names)==37)

#drop unecessary info
banded=banded.drop("spatial_ref").drop("band")

#must give data array a name
banded.name = "data"

#create df that has columns for band (0-36), y, x, and data (value for each of bands)
df = banded.to_dataframe().reset_index()
    
#combine x and y coords to one column that is "(x coord, y coord)"
df['coords'] = '('+ df['x'].astype(str) +", " + df["y"].astype(str) +')'
    
#reshape data long to wide so that each band is a column
df_reshape=pd.pivot(df, index='coords', columns='band', values='data')
    
#change column names (which are currently 0, 1, 2, etc. to band names)
df_reshape.columns = band_names

#remove rows that are empty. 
df_reshape = df_reshape.dropna(axis=0, how='all')
    

Not the answer you're looking for? Browse other questions tagged or ask your own question.