The "NASA/GLDAS/V021/NOAH/G025/T3H" GEE product corresponds to a global scale so, you don't need to filter it by a particular geometry. Complete dataset has 68023 images (8 images per day) whose availability is from 2000-01-01 to 2023-04-12. So, the main challenge is to create a function for transforming each 3 hours images product (8 images per day) to a daily product (approximately 8503 images) with the same resolution of original product (about 27829 square meters).
Another important fact is related to how to get ET values. At the description of Evap_tavg band, units are kg/m^2/s. As the involved element is water, kg/m^2 is equivalent to mm and the conversion factor of 86400 (24*3600) is used to obtain final daily values as accumulative variable (with ee.Reducer.sum). However, at ET_region is used the ee.Reducer.mean.
With all above considerations, the GEE script looks finally as follows (for only two years; 731 records for 2000 and 2001):
// Specify the region
var dataset = ee.FeatureCollection('USGS/WBD/2017/HUC12');
var ET_region = dataset.filter(ee.Filter.eq('huc12', '121003010201'));

//ET Data
var collection = ee.ImageCollection("NASA/GLDAS/V021/NOAH/G025/T3H")
  .select('Evap_tavg');

print("collection size", collection.size());

var scale = collection.first().projection().nominalScale();
print("scale", scale);

Map.addLayer(ET_region);
Map.centerObject(ET_region);

var startDate = ee.Date('2000-01-01');
var endDate = ee.Date('2002-01-01');

collection = collection.filter(ee.Filter.date(startDate, endDate));

print(collection.size());

var allDates = collection.aggregate_array('system:time_start');

var allDatesSimple = allDates.map(function(date){
  return ee.Date(date).format().slice(0,10);
  }).distinct();

print(allDatesSimple);

var days = endDate.difference(startDate, 'days');

print("days", days);

var daysStep = 1;

var dailyCol = ee.ImageCollection(
  ee.List.sequence(0, days.subtract(1), daysStep)
    .map(function (offsetDays) {
      var start = startDate.advance(offsetDays, 'days');
      var end = start.advance(daysStep, 'days');
      var composite = collection  // former lst
        .filterDate(start, end)
        .sum(); // You need to decide how to combine the images
      return composite.reproject('EPSG:4326', null, scale)
                      .set('system:time_start', start.millis());
    })
  );

print("scale", dailyCol.first().projection().nominalScale());
print(dailyCol);

var getET = function(image) {

  // Reducing region and getting value
  var value = ee.Image(image)
    .reduceRegion(ee.Reducer.mean(), ET_region)
    .get('Evap_tavg');

  return ee.Number(value).multiply(86400);
};

var values_list = dailyCol.toList(dailyCol.size()).map(getET);

print(values_list);

var list = ee.List.sequence(0, ee.Number(allDatesSimple.size()).subtract(1));

var features = ee.FeatureCollection(list
      .map(function (i) {
        return ee.Feature(null).set('date', allDatesSimple.get(i))
                               .set('ET', values_list.get(i));
      })
    );

print(features);

// Export features, specifying corresponding names.
Export.table.toDrive(features,
"export_ET", //my task
"GEE_Folder", //my export folder
"daily_ET",  //file name
"CSV");
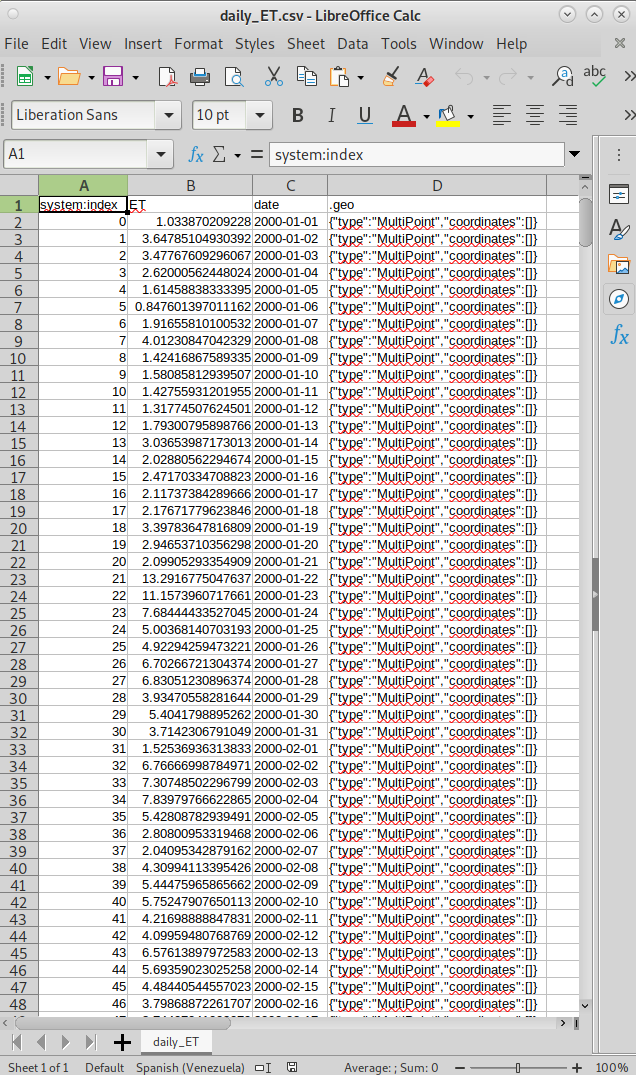
After running the complete script, CSV exported file look as follows:


