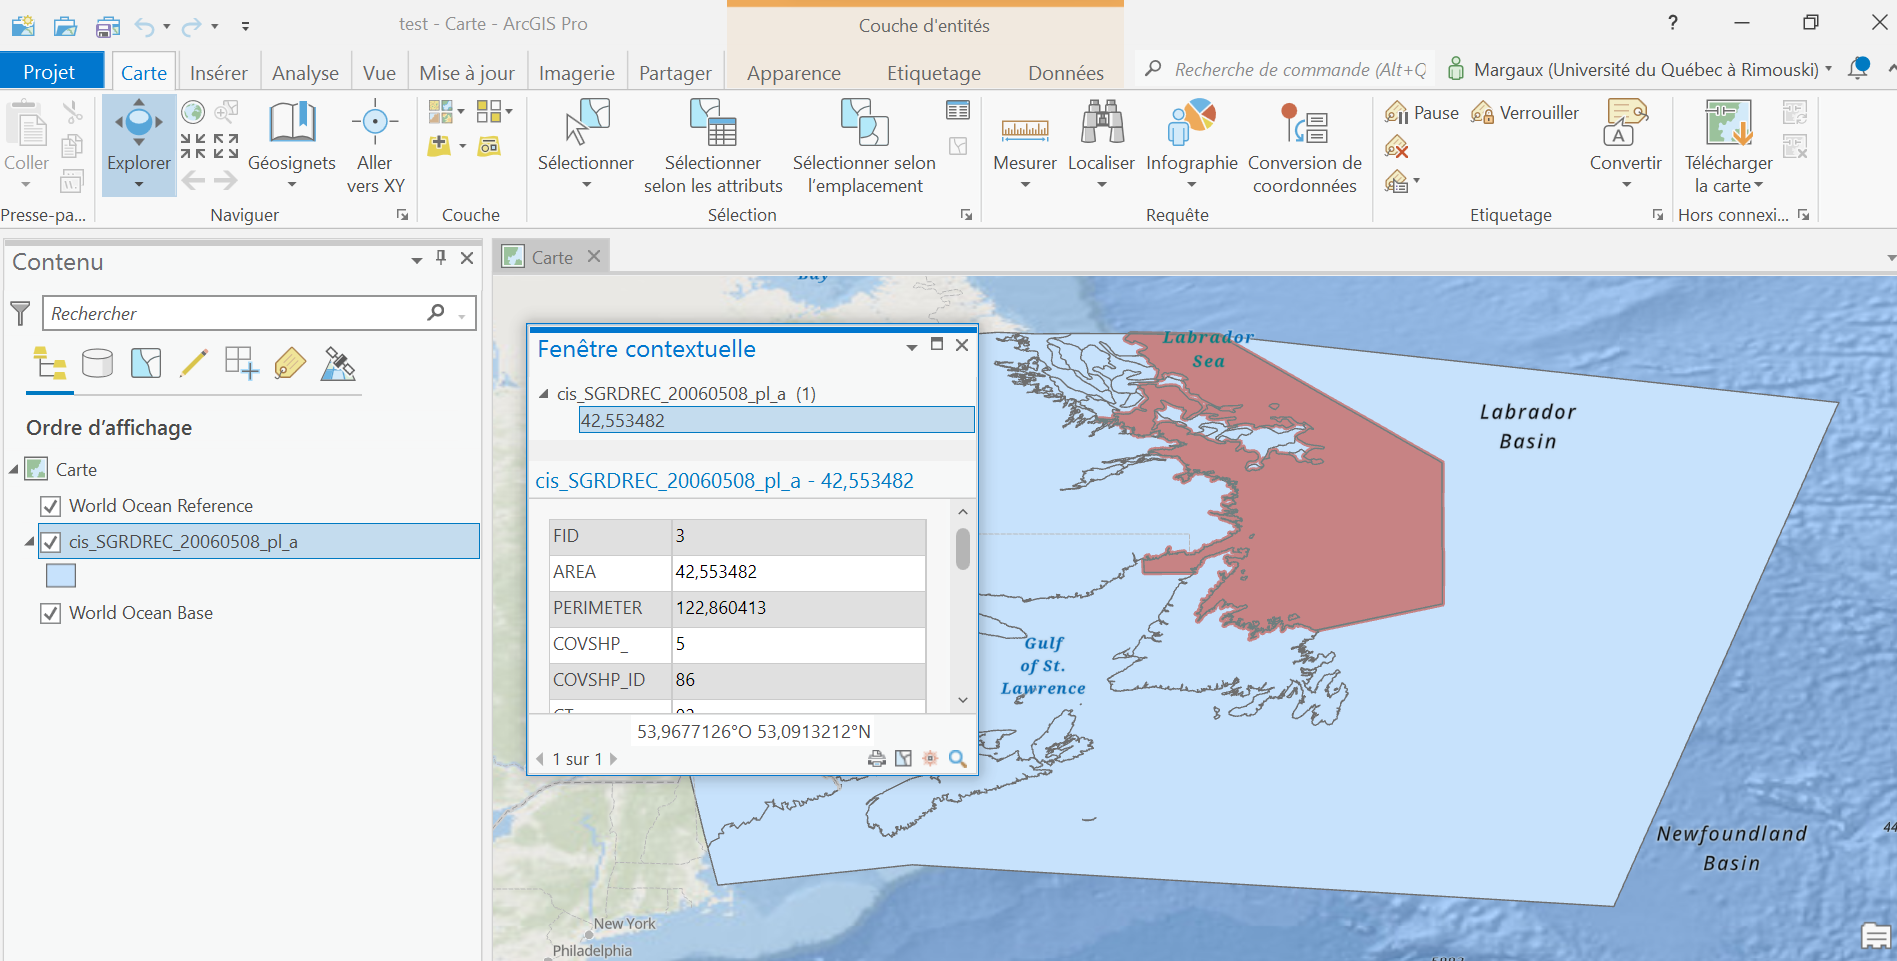
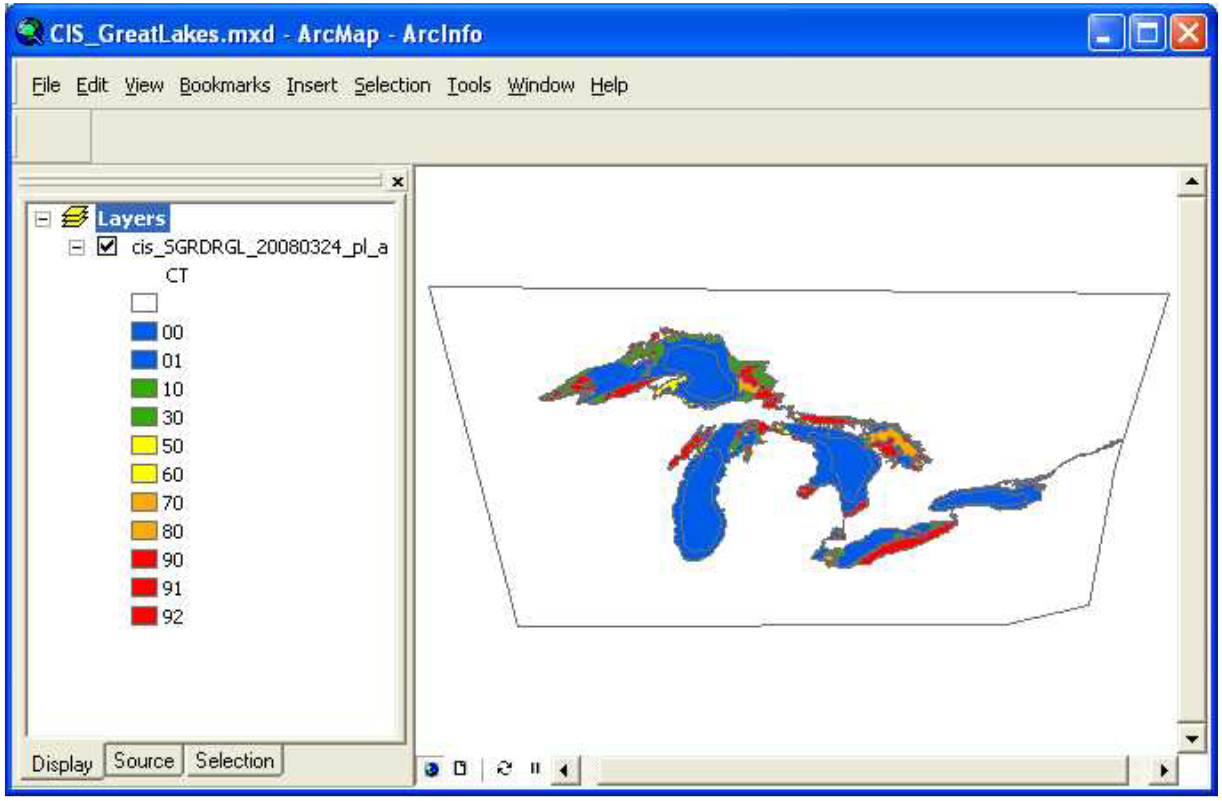
I'm a Master's student in oceanography research and I'm using the latest version of ArcGIS Pro. I am using data from the Canadian Ice Service Arctic Regional Sea Ice Charts in SIGRID-3 Format, Version 1. This type of data is based on a shapefile (.shp) format to store the shape geometry, this file is accompanied by an index file (.shx), there is a database file (.dbf) to store all the shape attributes in the main file, then there is an XML file (.xml) for the metadata related to each ice chart. This metadata includes projection, location, keywords and contact information. Since 2006, the Canadian Ice Service's ice charts have been made up of several different colored polygons (MMO) for different ice concentrations (CT = Concentration Total). However, when I open the shapefile (.shp) on ArcGIS Pro, the polygons are not displayed. I can open the shapefile as shown in the image below (figure 1 = What I see). The information is present when I touch a spot on the map, but I can't see the different-colored polygons as in the second figure (figure 2 = What I'd like to see). I can't find this information anywhere. Do you know how to help me, or do you know someone who does, please? Do you think that my version of ArcGIS Pro is too recent for this type of data?
-
Shapefile format is nearly 30 years old, and really ought to be retired by now. But that's got nothing to do with your problem. In fact, the XML file, which does contain metadata is not used to define projection, which may be your problem. If you don't have a .prj file, or didn't and set the wrong one, you would get the results you describe. Instead of describing the shapefile format, you should describe the content of the file, as described in layer metadata, like bounding rectangle and spatial reference contents.– VinceCommented Aug 29, 2023 at 20:45
Add a comment
|
1 Answer
Sounds like you just need to update the symbology. You can see if there's a .lyr or .lyrx file available (and then use it to run Apply Symbology from Layer), or you can do it manually.
- Open the Symbology pane (you can find it under the View tab).
- Under Primary symbology select Unique Values, and then select the CT field in the Field 1 dropdown.
- Apply colors based on the version you show in ArcMap.
-
If you have the layer from the second example saved, you can copy it to your map and point it to your data (assuming the same data fields) by changing the source property. You don't have to keep rebuilding symbology for every dataset.– danakCommented Sep 5, 2023 at 22:34
-
I haven't found an NSIDC layer, but do you think I could create my own layer based on the same colors as the Canadian Ice Service ice charts, and then apply it to my shapes? Commented Sep 7, 2023 at 18:48
-
Yes, you totally should be able to create your own symbology layer for on going use. Commented Sep 8, 2023 at 13:15
-
Do you know how to do this in ArcGIS Pro? I don't know this software very well, so I have a lot of gaps. Commented Sep 8, 2023 at 15:54
-
Here's how to save from Pro: support.esri.com/en-us/knowledge-base/… Commented Sep 8, 2023 at 20:28


