I'm trying to plot a data about Istanbul's metro lines. The actual data is in CSV format and all of the data is in string. The data is from Istanbul Metropolitan Municipality (https://data.ibb.gov.tr/tr/dataset/rayli-ulasim-hatlari-vektor-verisi/resource/ba2ab5a2-32f4-4989-a2c5-99c15c066eb5?inner_span%3DTrue, I'm using the 2022 version but you may not see it if you'll look up the website in English)
I cannot plot data. As I looked up to the data, I found that the geometry of data is in strings, not in the geometry format. Here is my code in Python:
railway = gpd.read_file("https://data.ibb.gov.tr/tr/dataset/8b8603dd-2642-4789-a891-4bb7cb2c94e8/resource/ba2ab5a2-32f4-4989-a2c5-99c15c066eb5/download/2022-yl-rayl-ulam-hatlar-vektor-verisi.csv",
                       )
railway = railway.drop(columns = ["field_7", "field_8", "geometry"])
# Since geopandas didn't understand GEOMETRY column as its geometry, I've dropped it.
railway = railway.rename(columns={"GEOMETRY": "geometry"})
railway['geometry'] = gpd.GeoSeries.from_wkt(railway['geometry'])
After the last code line, I got this error: GEOSException: ParseException: Expected number but encountered end of stream
I also saw some paranthesis are missing in the data, for example:
'LINESTRING (409172.2555999998 4543322.3401999995,409309.8761999998 4543344.789000001,409363.8706 4543363.26,409446.2838000003 4543404.466,409493.17360000033 4543439.988399999,409578.4283999996 4543516.716600001,409609.6453999998 4543551.567399999,409725.3764000004 4543679.956599999,409880.42200000025 4543871.432,409896.0042000003 4543892.275,409925.51020000037 4543934.8728,409946.11479999963 4543963.178200001,409985.77799999993 4544017.081,409995.86000000034 4544030.033399999,410002.51379999984 4544037.8484000005,410012.9956 4544049.1241999995,410056.96580000035 4544091.2226,410072.9104000004 4544108.399599999,410196.1012000004 4544260.002800001,410244.0303999996 4544315.581800001,410309.60259999987 4544397.136600001,410372.85759999976 4544474.330800001,410379.07079999987 4544482.9969999995,410382.8382000001 4544489.619200001,410386.57660000026 4544497.9616,410389.0114000002 4544505.1811999995,410390.8077999996 4544512.585200001,410391.9517999999 4544520.117799999,410392.43539999984 4544527.7217999995,410392.2542000003 4544535.3386,410391.1617999999 4544544.4146,410388.6972000003 4544554.7892,410384.83220000006 4544565.1338,410355.4784000004 4544616.7535999995,410320.8043999998 4544676.4428,410293.7879999997 4544716.8686,410288.10819999967 4544724.605599999,410282.0064000003 4544731.5692,410275.2101999996 4544737.856799999,410268.8830000004 4544742.659,410223.5246000001 4544769.526799999,410212.9154000003 4544775.218800001,410197.4195999997 4544782.705,410057.5310000004 4544842.991800001,409873.23479999974 4544923.1776,409639.35539999977 4545029.6208,409617.2614000002 4545042.3158,409597.60840000026 4545055.3772,409579.05420000013 4545070.6358,409559.5237999996 4545088.7016,409545.7302000001 4545104.2042,409534.01159999985 4545118.729800001,409524.7346000001 4545132.2796,409506.6688000001 4545161.087200001,409494.50260000024 4545184.666200001,409465.6947999997 4545245.536800001,409371.29619999975 4545447.028000001,409360.39159999974 4545466.233200001,409327.1891999999 4545518.966,409319.05140000023 4545535.567,40'
In here, there isn't a number after 40 (look to the last number), so the other coordinate is missing and there isn't a paranthesis after all of the points. There are similar missing coordinates and paranthesis like this in other rows.
To eliminate missing values, I used this:
def clean_geometrylist_LineString(coordinates):
    cleaned_coordinates = []
    for coord in coordinates:
        lat_lon = coord.split()
        if len(lat_lon) == 2:
            cleaned_coordinates.append([float(lat_lon[0]), float(lat_lon[1])])
        elif len(lat_lon) == 3:
            if "(" in lat_lon:
                lat_lon.remove("(")
            elif ")" in lat_lon:
                lat_lon.remove(")")
            else:
                raise SyntaxError("Look up!!!!!!!!!!")
            cleaned_coordinates.append([float(lat_lon[0]), float(lat_lon[1])])
    return cleaned_coordinates

def clean_geometry(geometry_string):
    geom_type = geometry_string[:geometry_string.index("(")]
    geometry_string = geometry_string.replace(geom_type, "")
    geometry_string = geometry_string.replace("(", "(,")
    geometry_string = geometry_string.replace(")", ",)")
    coordinates = geometry_string.split(',')

    if geom_type == "LINESTRING ":
        cleaned_coordinates = clean_geometrylist_LineString(coordinates)
        clean_geo = shapely.LineString(cleaned_coordinates)
    elif geom_type == "MULTILINESTRING ":
        cleaned_coordinates = clean_geometrylist_LineString(coordinates)
        clean_geo = shapely.LineString(cleaned_coordinates)

    return clean_geo
railway['geometry'] = railway['geometry'].apply(clean_geometry)
railway = gpd.GeoDataFrame(railway, geometry='geometry')
But now, when I plot the data, I get this:
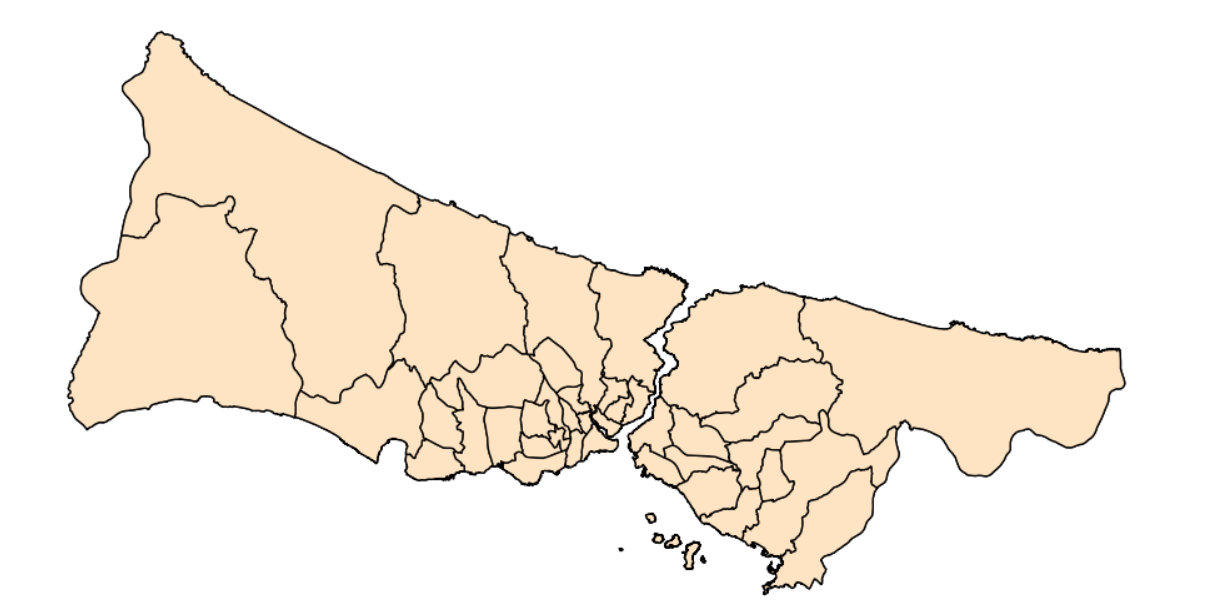
I also plotted the Istanbul's districts on the same axis with the metro lines.The first picture is the districts of Istanbul. The second one is the plot on the same axis with the metro lines. So as you can understand, it isn't what I was expecting.
Also, when I want to print the coordinate reference system of the data, it doesn't print out anything.
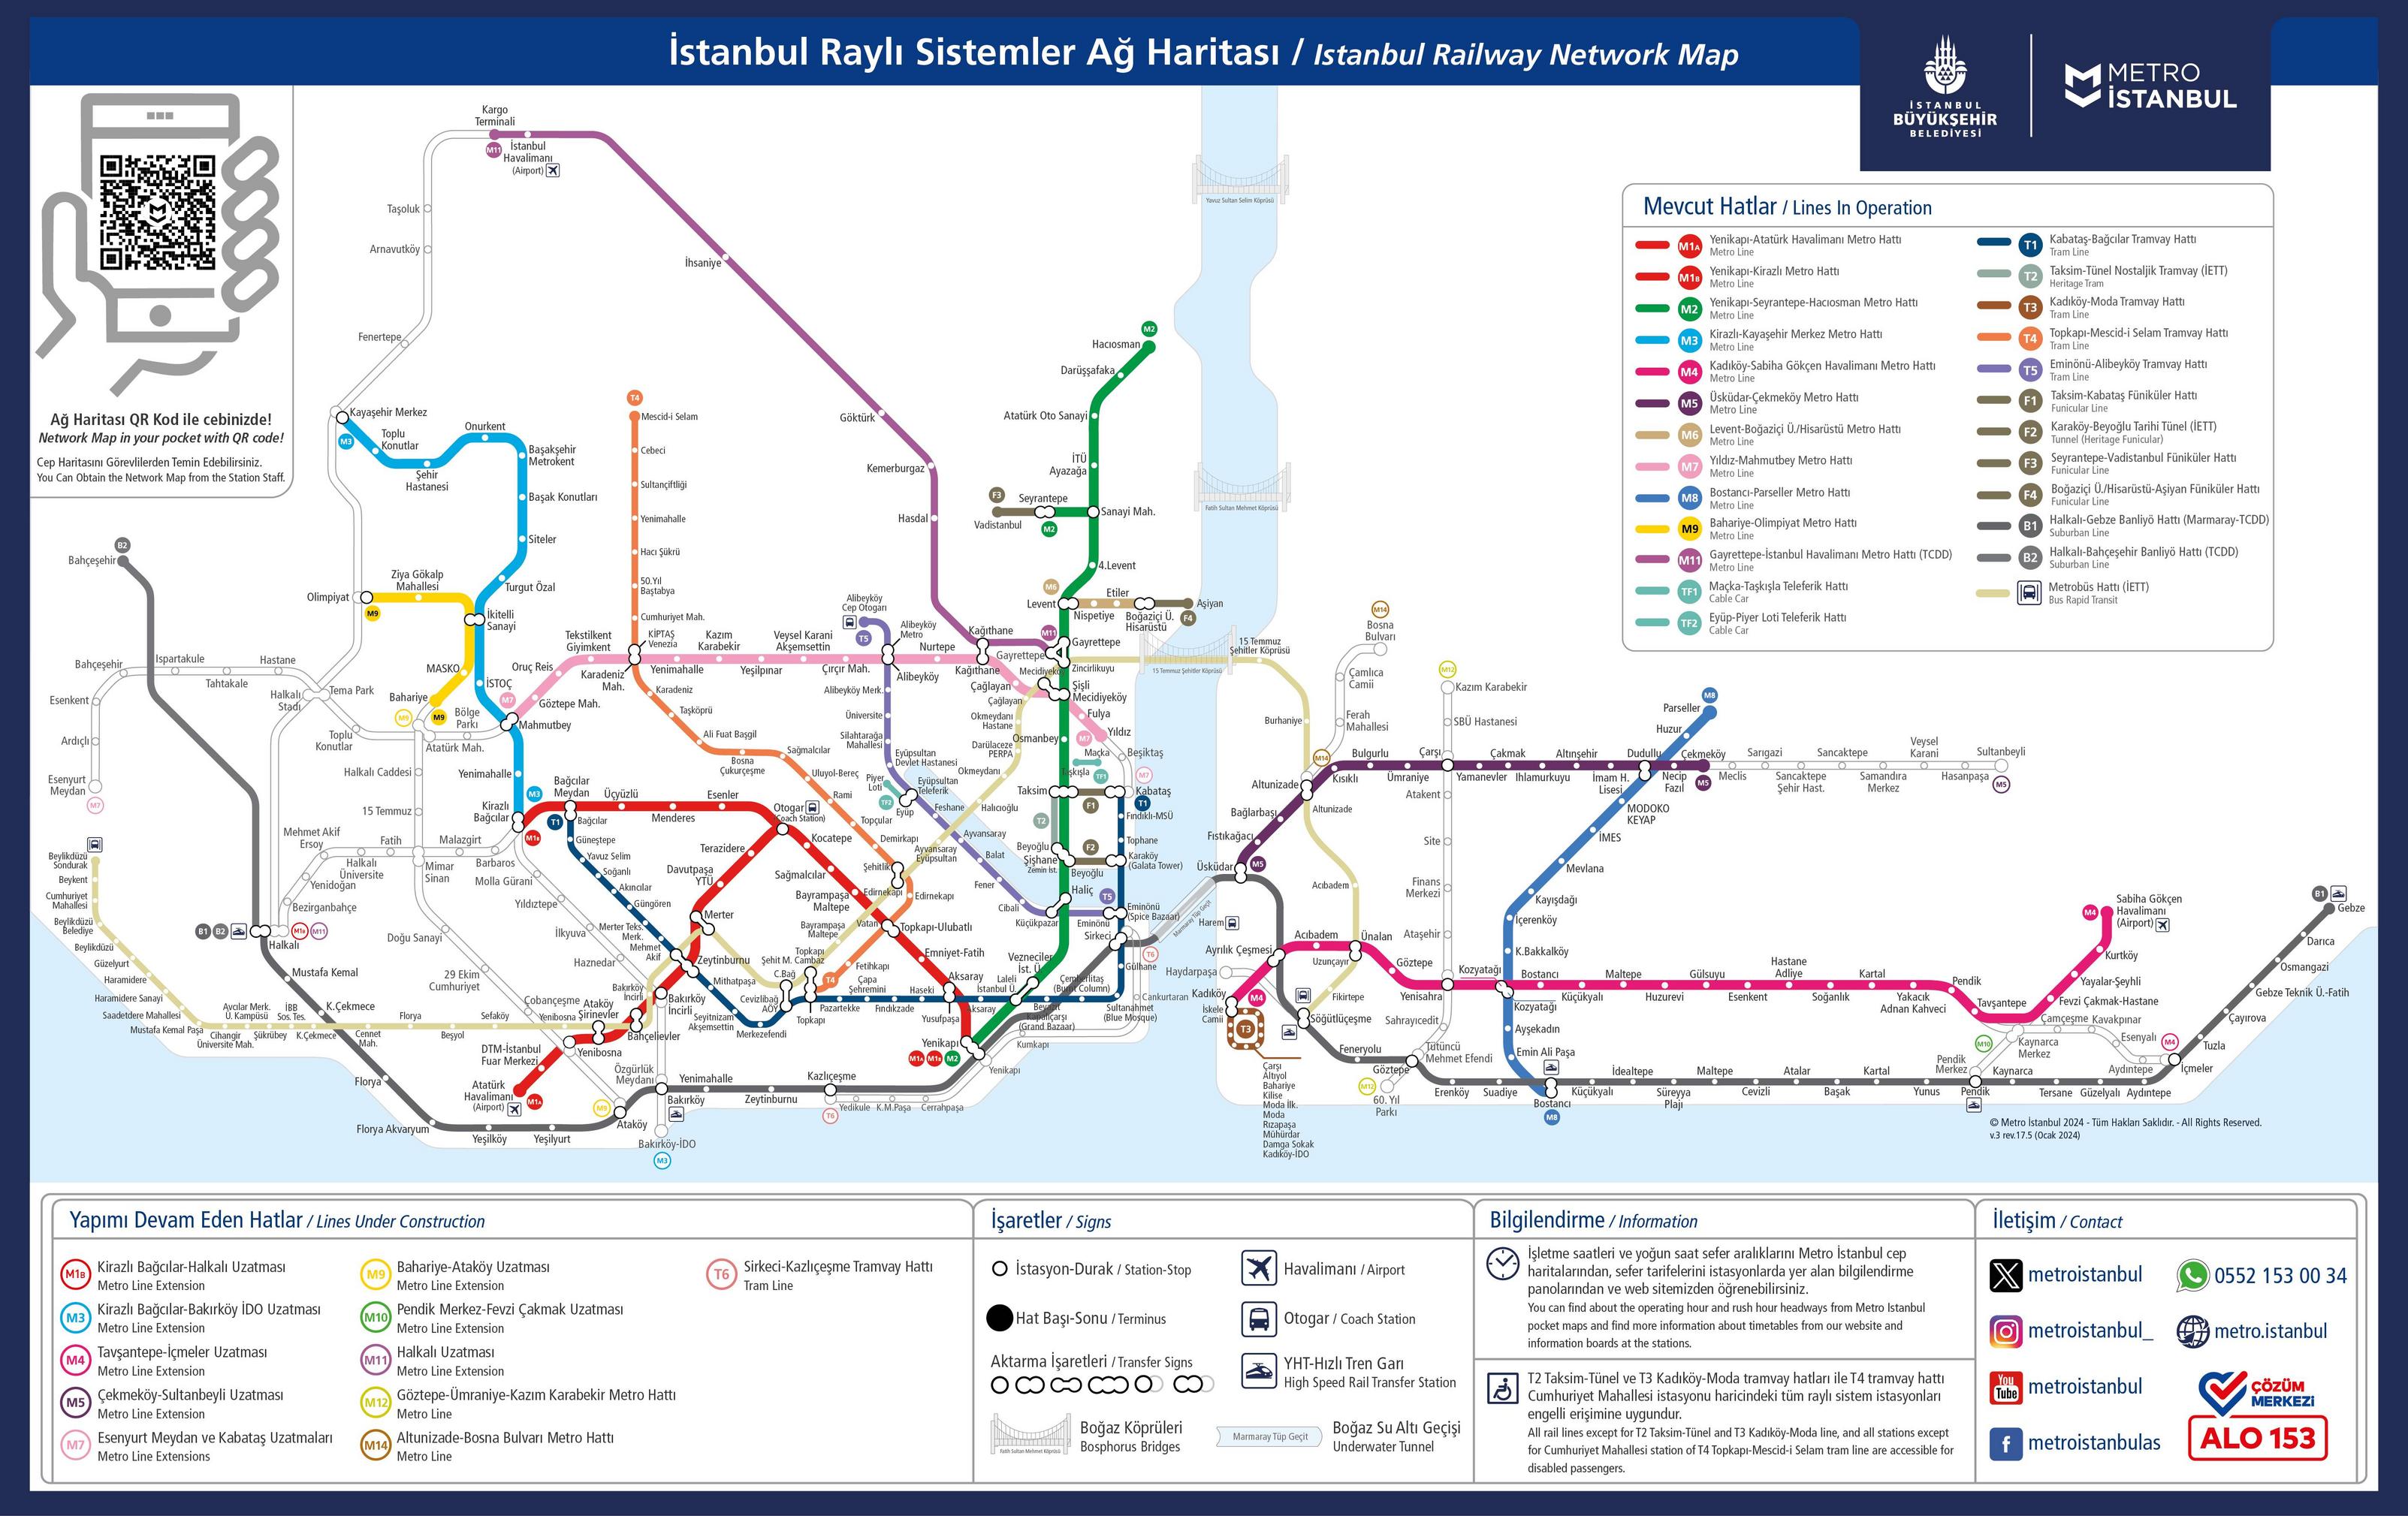
I'm confused because I've been struggling with this data for about 5 hours. My intention is to plot like this map:
https://www.metro.istanbul/resim/resimad/raylisistemler-agharitasi-v3r17_5
It may be so long (I admit, it is...) but could I do this?


