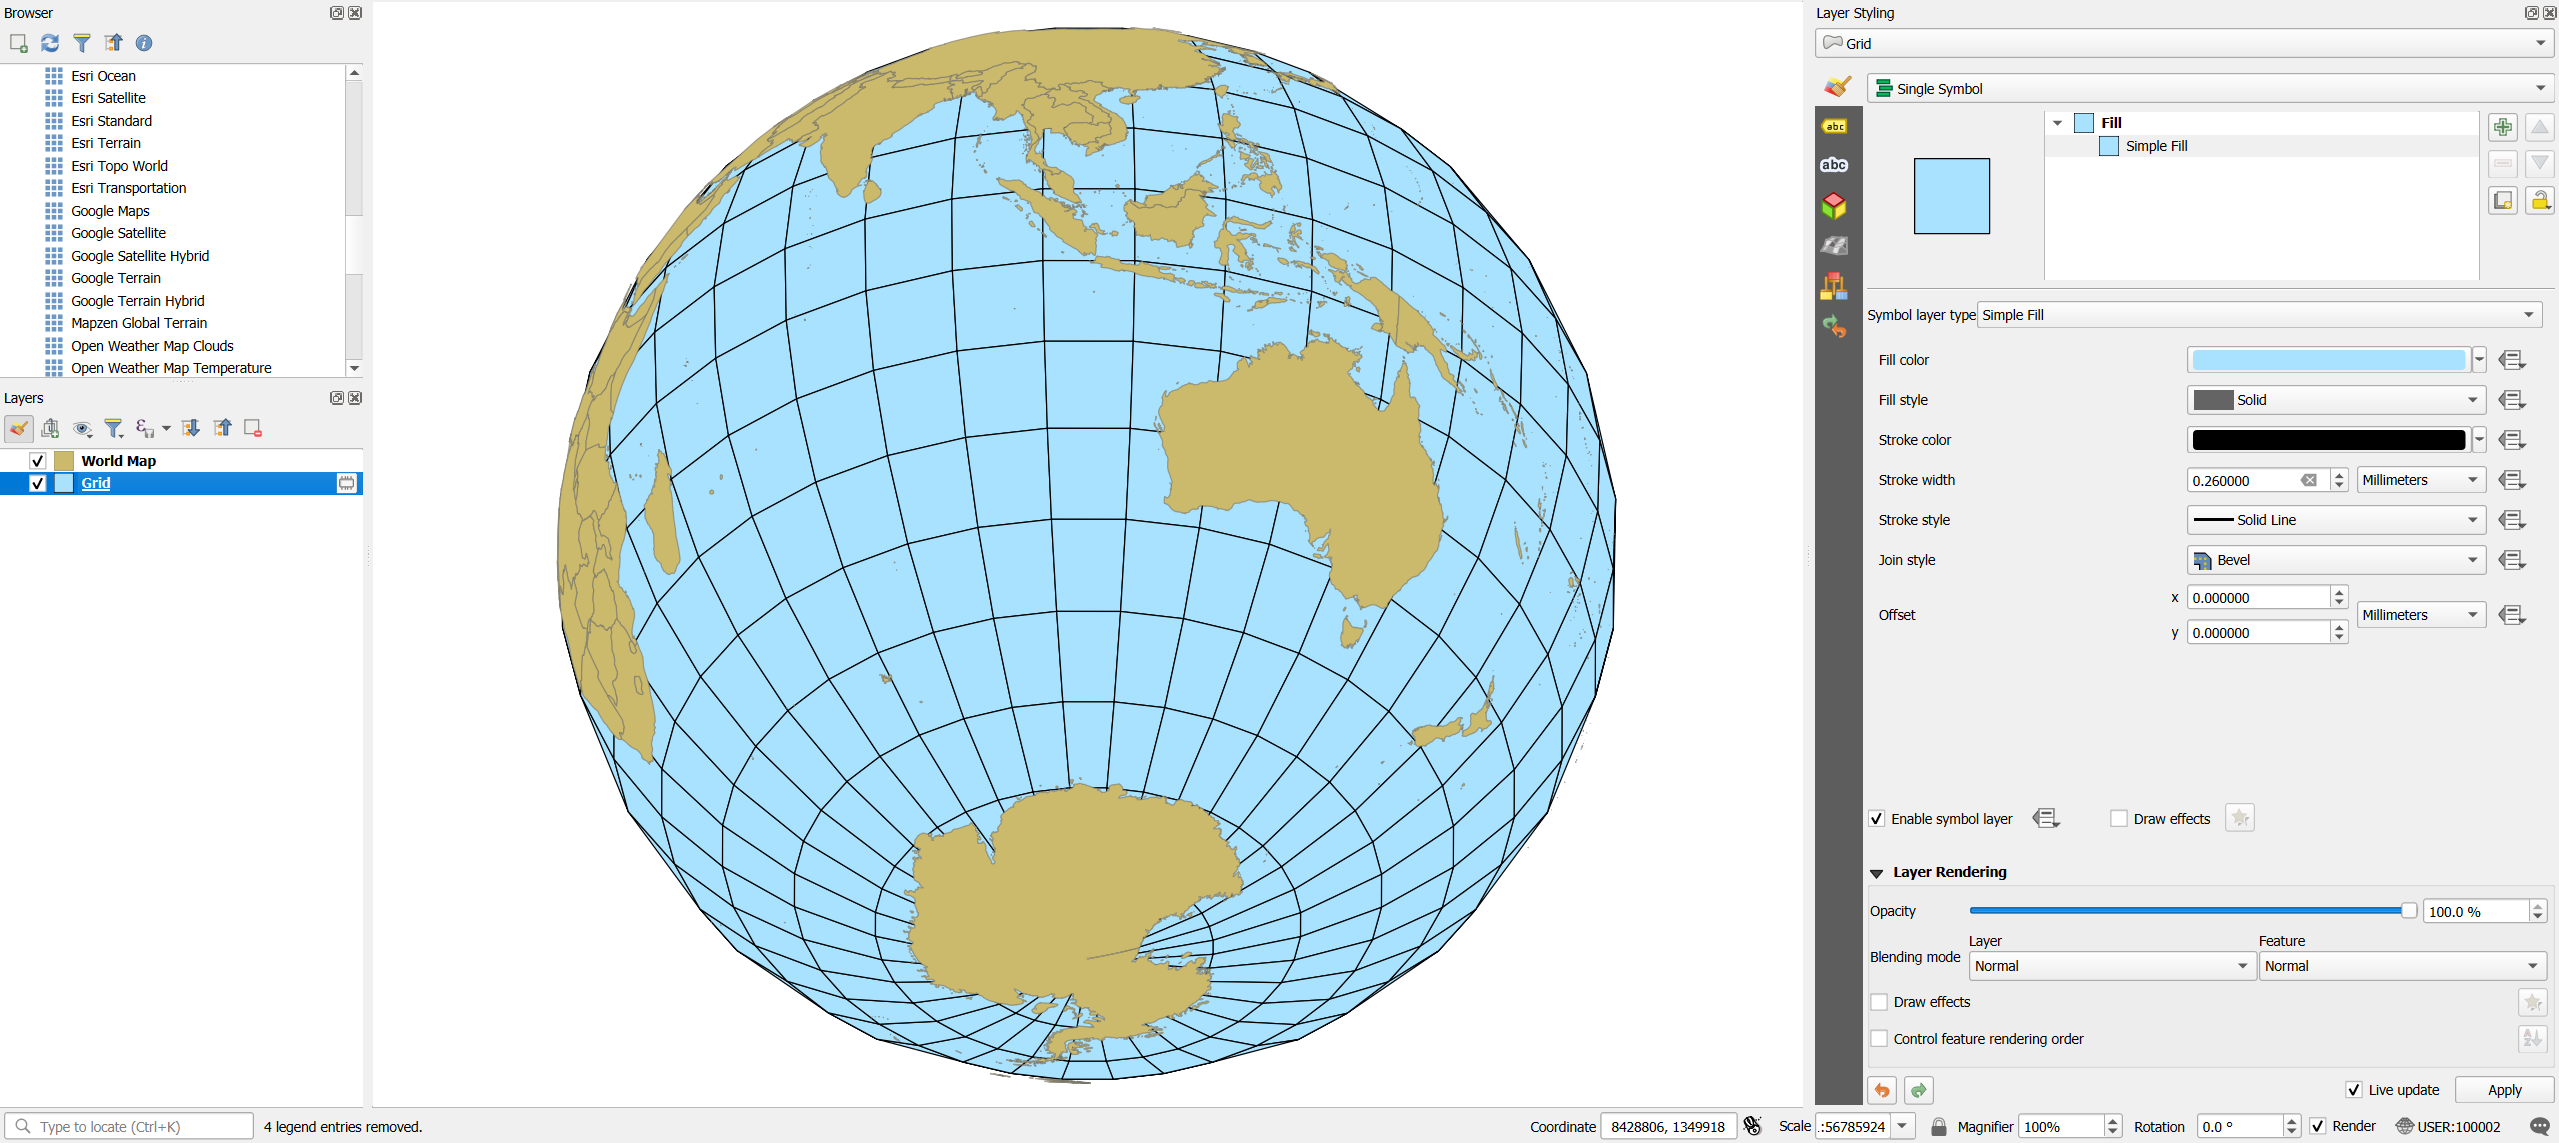
Create a grid (Menu Vector > Reasearch Tools > Create Grid), based on your layer World Map. As grid extent, use the layer extent. As this layer is in EPSG:4326, use a convenient horizontal and vertical spacing, e.g. 10 degrees.
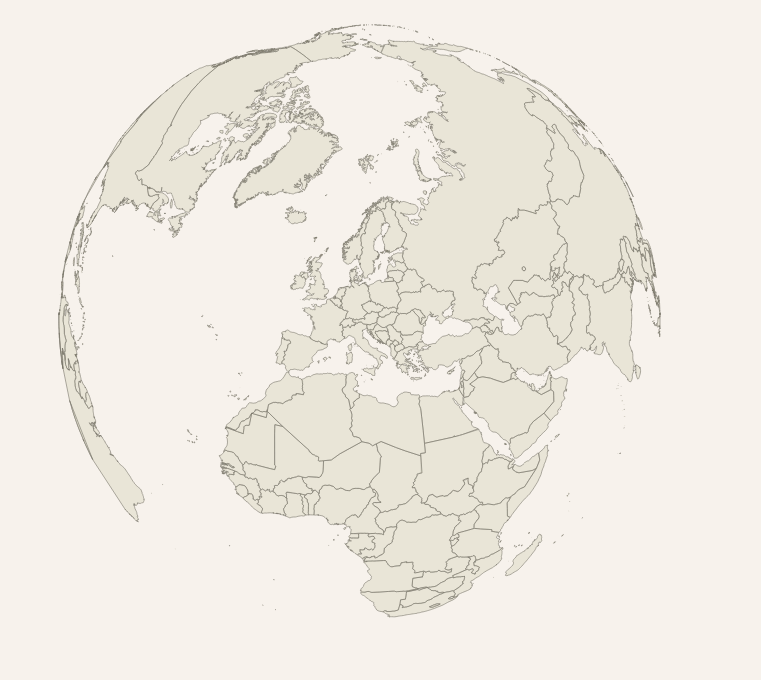
When you now set the project CRS to your custom CRS, you get the desired effect, see screenshot. For an explanation why your approach did not work, see below.
Screenshot: To get rid of the black lines, set their color to the same color as the polygon fill. To smooth the lines, densify the grid polygons:

Explanation:
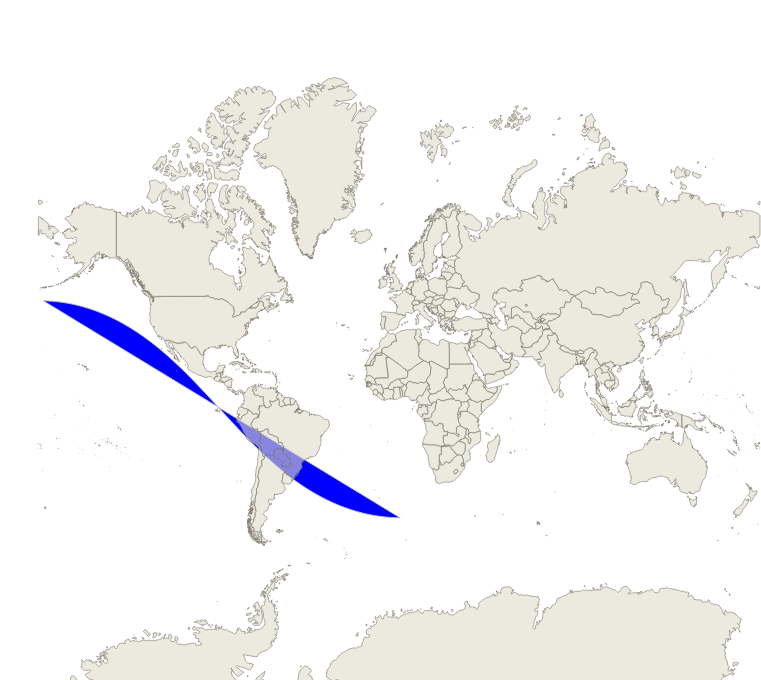
So why don't you see the extent, created in EPSG:4326 in your custom projection? You have to think about the property of the extent, which does not represent a real-world phenomenon, but refers to borders of the (projected) map canvas. Extent is from -180 (on the left) to +180 (on the right) on the map canvas.
In reality, however, 180 and +180 represent the same points (or very close), all of them laying on the antimeridian. QGIS connects them with the shortest line in the current projection, so does not use the "detour" to cover the whole globe.
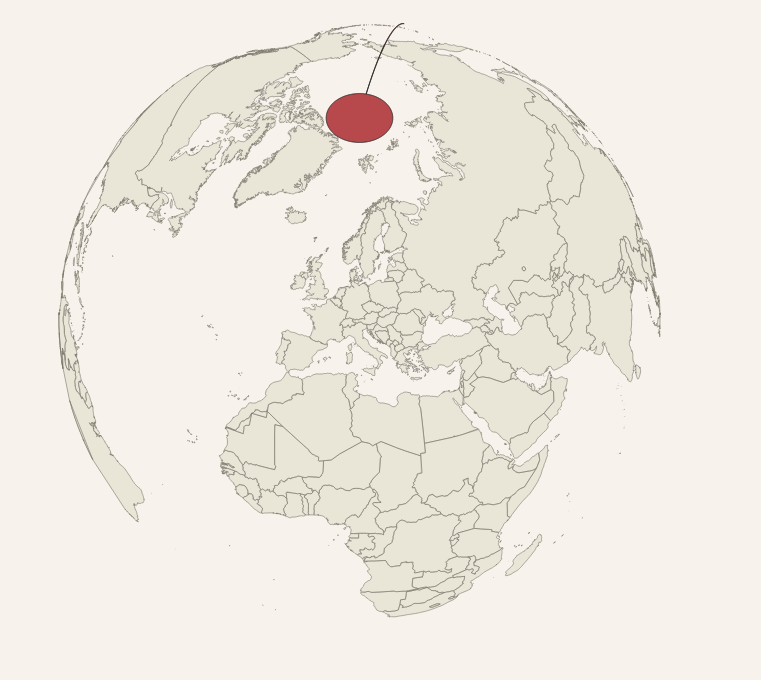
So connecting all these points in your custom projection results in a very thin polygon or even a line in your custom projection: the line you have in the upper port of your first screenshot.
The red circle probably stems as well from the initial CRS that you used to create the extent.
By creating a grid, we have smaller cells (patches) with vertices evenly distributed all over the globe.


