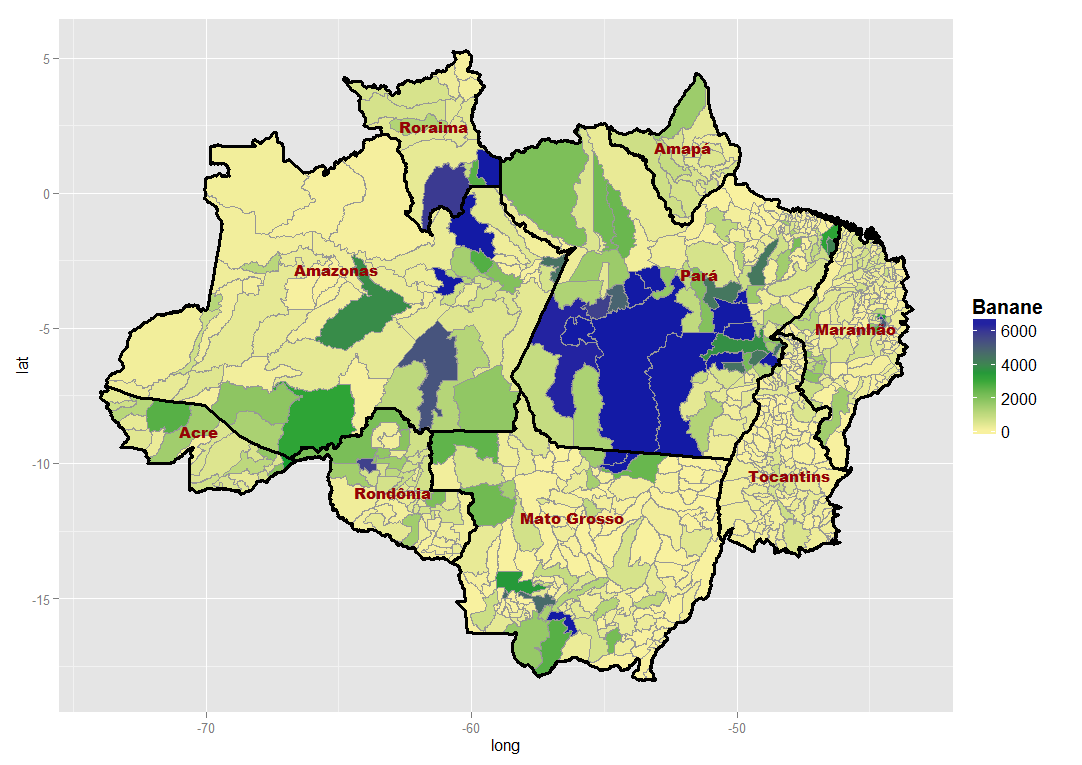
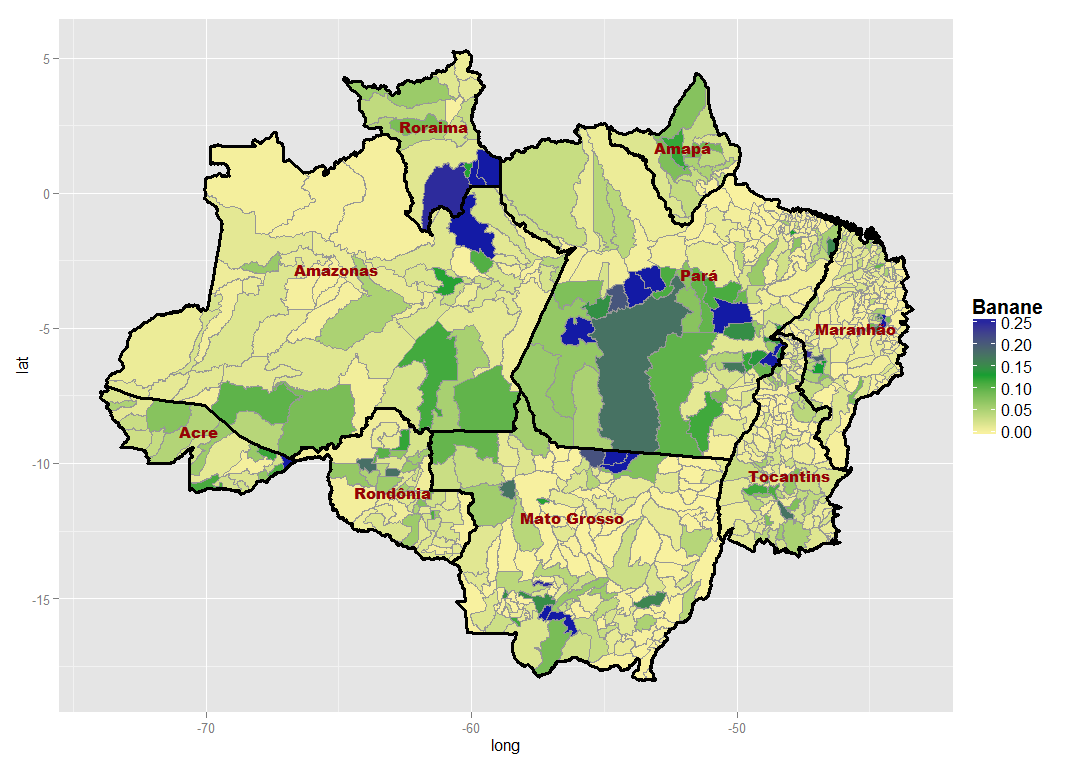
I have agricultural data in form of polygons which I would like to test for spatial clusterings/spatial agglomerations.
All in all I have about 40 variables which I can aggregate and standardize in different ways. One way of standardization could be for example to calculate production values per capita within each polygon. Another way could be to calculate production values per ha within each polygon.
All ways of standardization and aggregation produce different maps with different spatial patterns: clusterings and no-clusterings. So as a base for my later analysis I wan't to identify such aggregation/standardization combinations that produce strong spatial clusterings. Therefore I would need to compare the different results from aggregation and standardization.
Of course I could do this looking manually at the maps (see example below). But this is quite subjective and only in some case you can make clear distinctions. Imagine doing this for 40 variables and let’s say 8 possible ways of data preparation… So I would prefer to use some objective measurement i.e. spatial statistics.
I use R and Arc GIS. Has anyone an idea how to implement such an analysis?
The examples below show Banana Production once without standardization and once standardized per capita. they look very similar, but which one is more spatially clustered?


